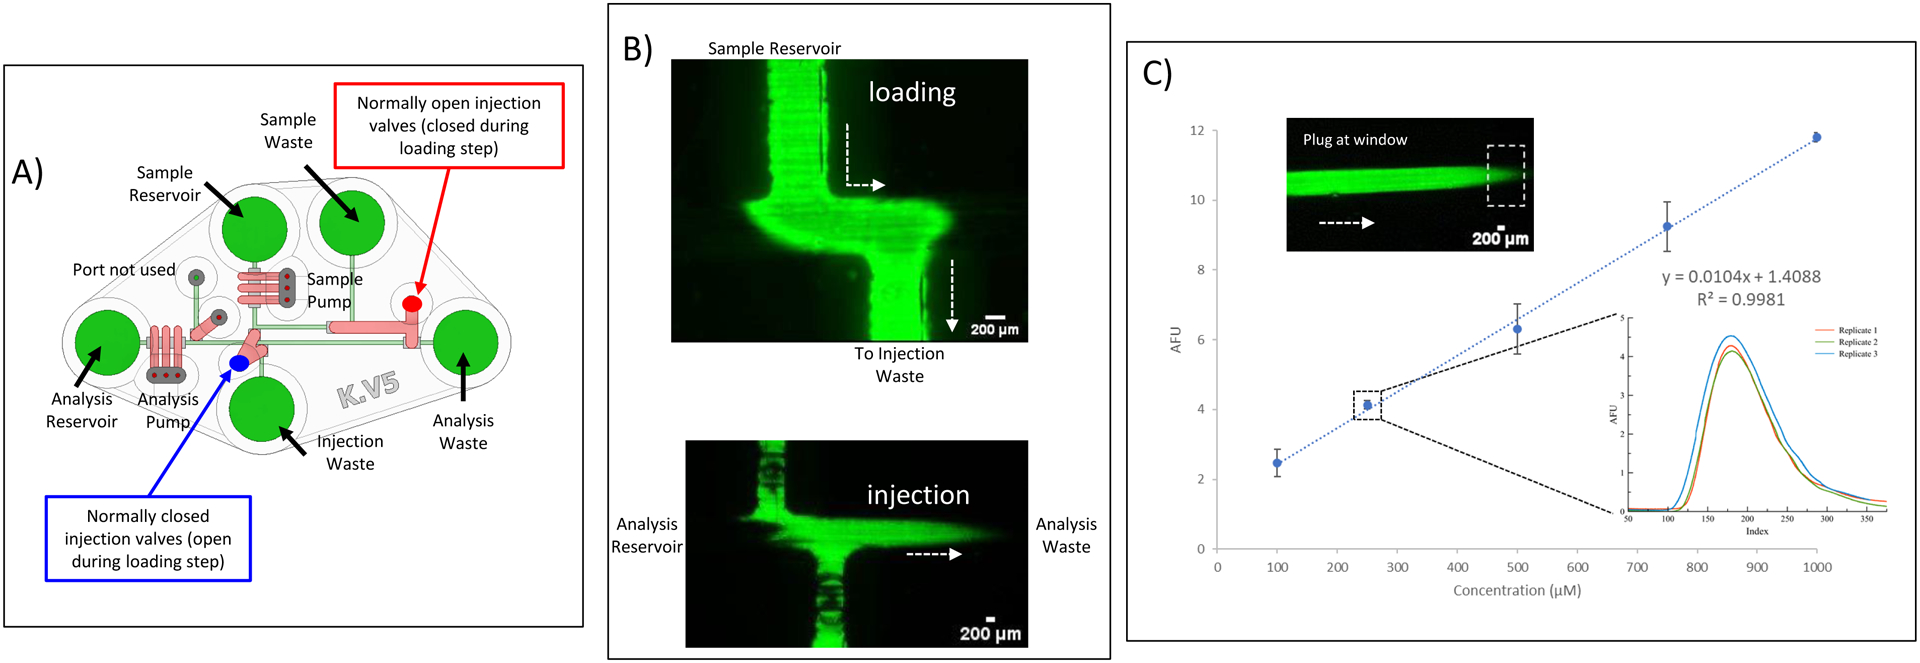
Figure 5.

Loading and Injection of Sample with the pumps and valves. A) Annotated CAD rendering (top-down view) of fully assembled chip, with specific labels of which valves are normally open (during injection/analysis step) and which are normally closed. During the loading/fill step, the valve states are reversed. B) Fluorescence micrographs of loading and injection process, with the loading micrograph being taken at the sample/analysis channel intersection and the injection micrography just downstream from the intersection. Injection volume is 300 nL. C) Calibration curve for injections of various fluorescein concentrations (100 – 1000 μM), with the plot inset containing an overlay of 3 separate injections of a 250 μM fluorescein solution. Micrograph shows plug at the detection window (outlined with dotted box).
