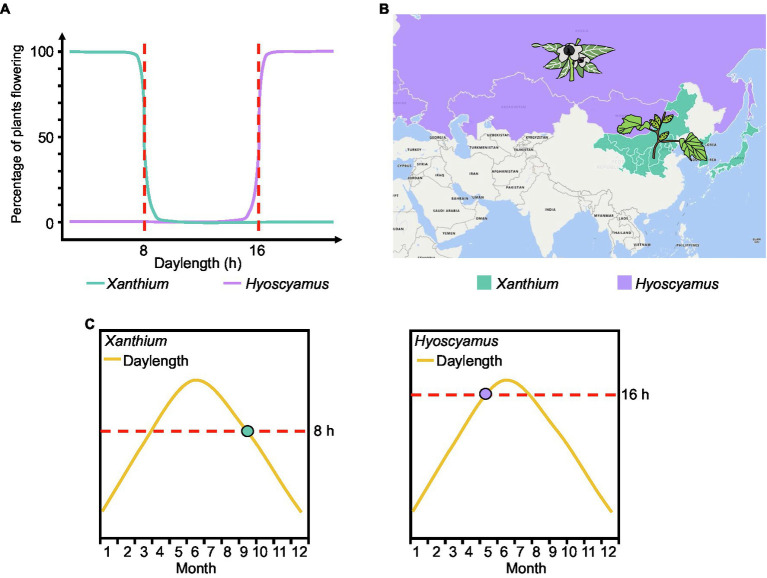
Figure 3.
Traditional and new measurement methods of critical daylength. (A) As the flowering ratio of plants under different daylengths. The red dotted line represents the critical daylength. (B) Geographical distribution of Xanthium and Hyoscyamus. (C) Putative expression time point of the florigen genes in Xanthium and Hyoscyamus. The dots represent the point when the florigen begins to be expressed.

