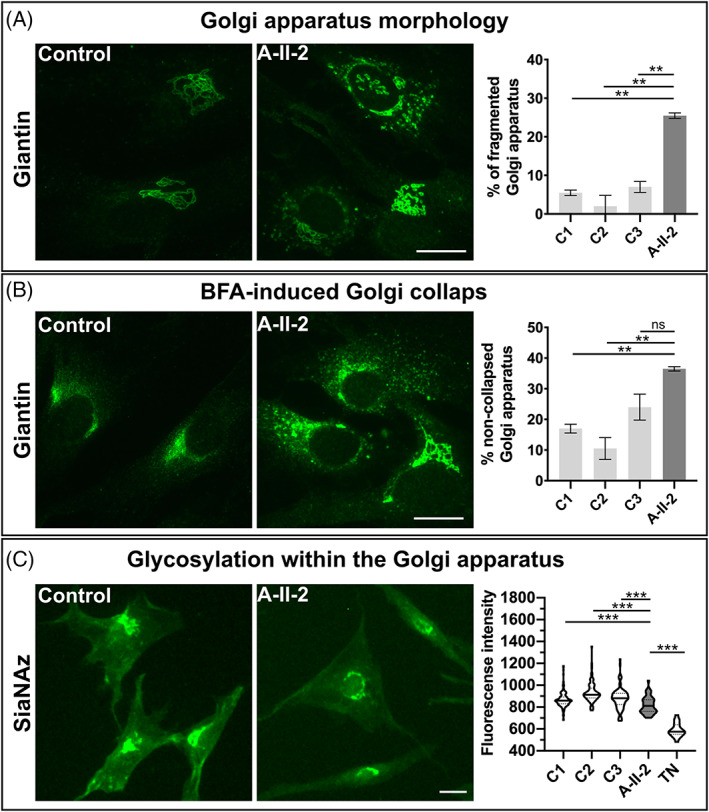
FIGURE 3.

Abnormal function of the Golgi apparatus: A, Morphology of the Golgi apparatus was evaluated using immunofluorescence staining of Giantin. In control cells the Golgi apparatus showed regular cisternae whereas in proband A‐II‐2 fibroblasts the Golgi structure was dilated and fragmented. In controls below 10% of cells showed a fragmented and dilated Golgi, whereas in the cells from individual A‐II‐2 more than 25% of cells showed this fragmentation (**P < .01). Scale bar: 100 μm, B, Brefeldin A‐induced Golgi collapse. All cells were treated with BFA and Golgi collapse was measured in controls and cells from individual A‐II‐2 after 9 minutes. The Golgi collapse was significantly reduced in the proband's cells in comparison to controls (**P < .01=; ns = not significant. Scale bar: 100 μm, C, Glycosylation within the Golgi apparatus. Metabolic labelling of intra‐Golgi sialylation via the analysis of SiaNAz incorporation. In cells from individual A‐II‐2, we found a significant reduction of SiaNAz fluorescence indicating a glycosylation abnormality within the Golgi apparatus in comparison to controls (***P < .0005). Scale bar: 100 μm
