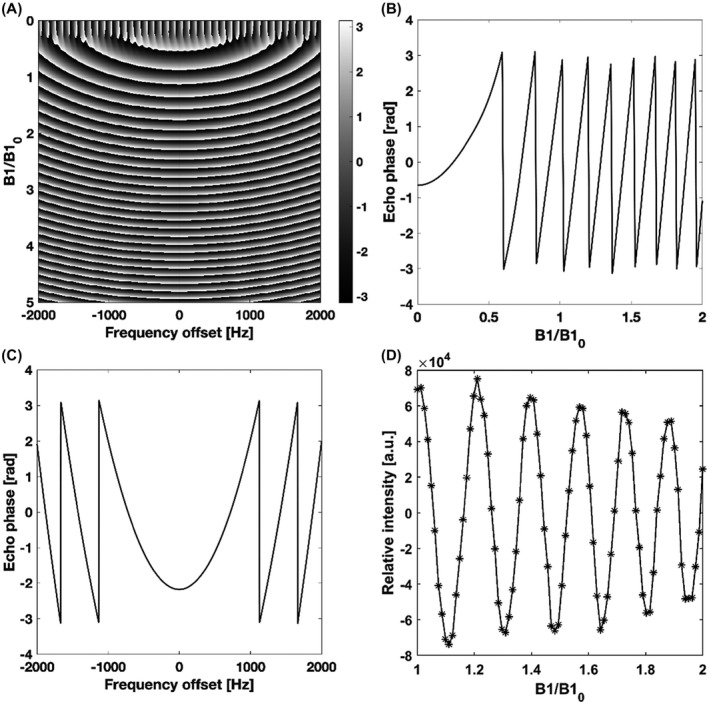
FIGURE 5.

A, Simulated phase profile of the odd echoes as a function of frequency offset and relative B1 amplitude. B, The approximately linear phase ramp caused by varying the B1 field. C, Quadratic echo phase variation with frequency. D, Relative intensity of the real part of the first spin echo with increasing B1 amplitude
