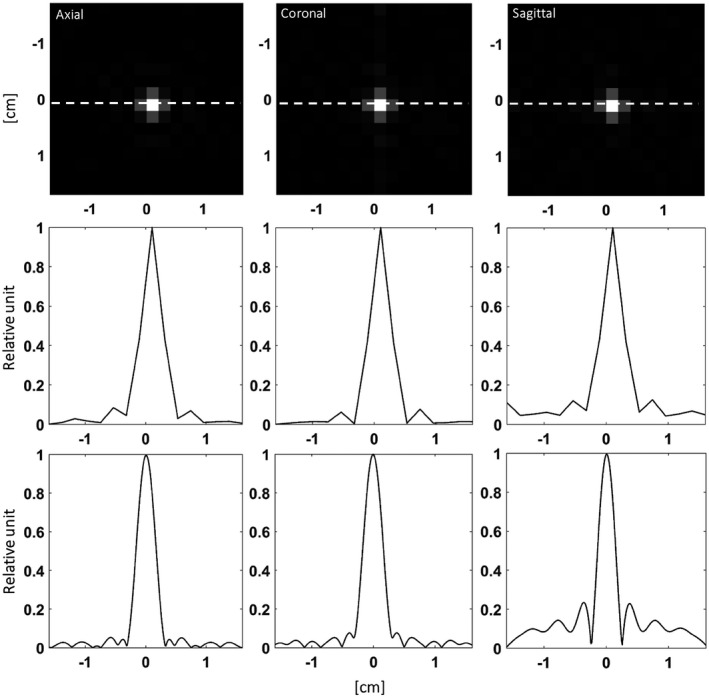
FIGURE 6.

The central slices of the simulated point spread function (PSF) for the 3D cones readout reconstructed at the nominal 2 mm resolution. The numbers along the axes represent the distance from the isocenter in units of cm in each direction. The line profiles along the white dashed lines are plotted in the second row. The third row shows the same line profiles when the PSF was reconstructed at a digital resolution of 0.25 mm, which was the inplane resolution of the 1H images
