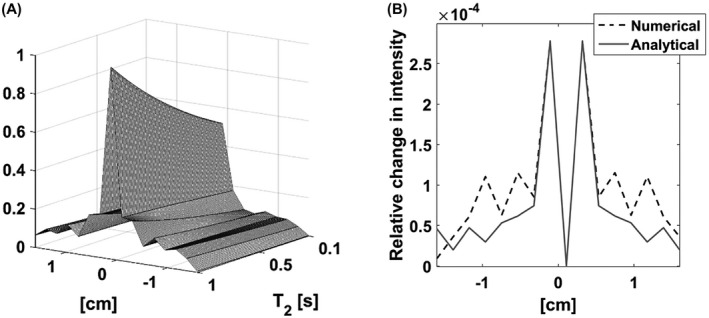
FIGURE 8.

A, The effect of T 2 relaxation time on the z‐profile point spread function (PSF). B, Comparison of the first‐order change in the z‐profile PSF at R 2 = 0 derived analytically with the PSF z‐profile derived numerically from the difference between the profiles for T 2 = 4s and for R 2 = 0 (ie, when relaxation is neglected)
