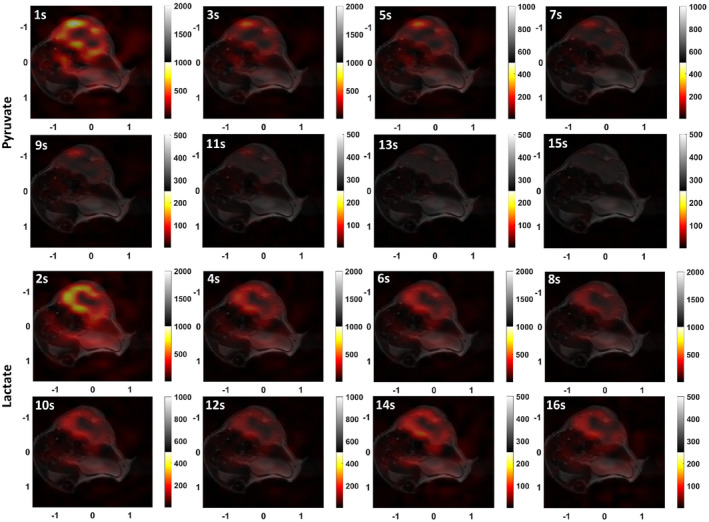
FIGURE 10.

Dynamic hyperpolarized [1‐13C]pyruvate and [1‐13C]lactate images overlaid on the corresponding 1H image for slice 9. The odd time points correspond to pyruvate and the even time points to lactate. For better visualization of the 13C signal the scale is decreased at later time points
