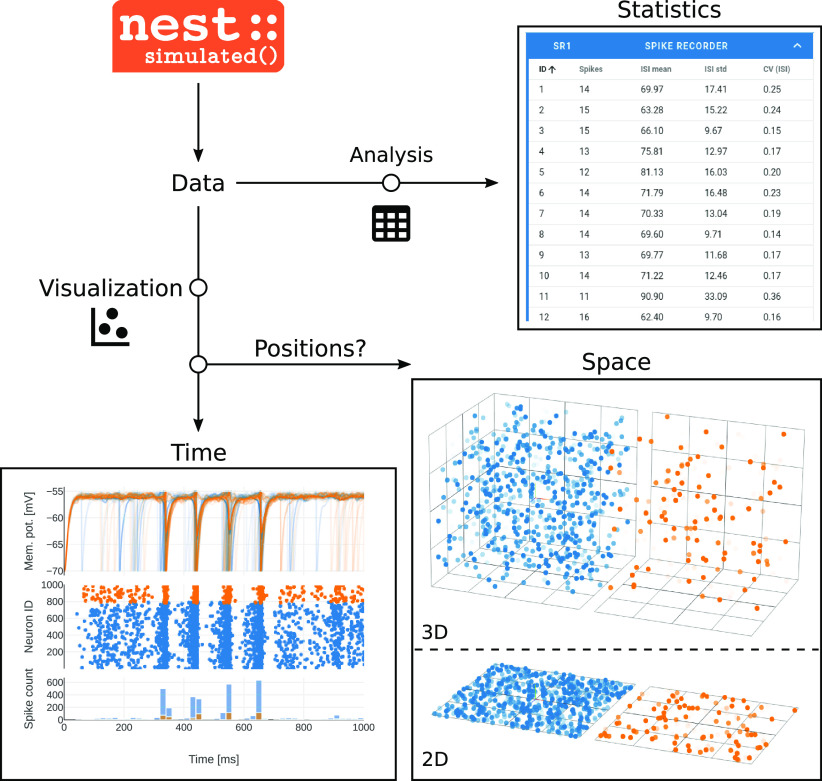
Figure 7.
Data analysis and visualization. The NEST simulator executes the network simulation and returns recorded activity data to be analyzed and visualized (top left). Quasi-analog signals like membrane potentials and discrete spike times can be displayed across time (bottom left). Such visualization is accompanied by basic analysis like the computation of spike counts. If the neurons in the simulated network are arranged in space, a 2D or 3D animation offers a view of the ongoing activity at the respective neuronal positions (bottom right). Calculated quantities are presented in table format (top right).

