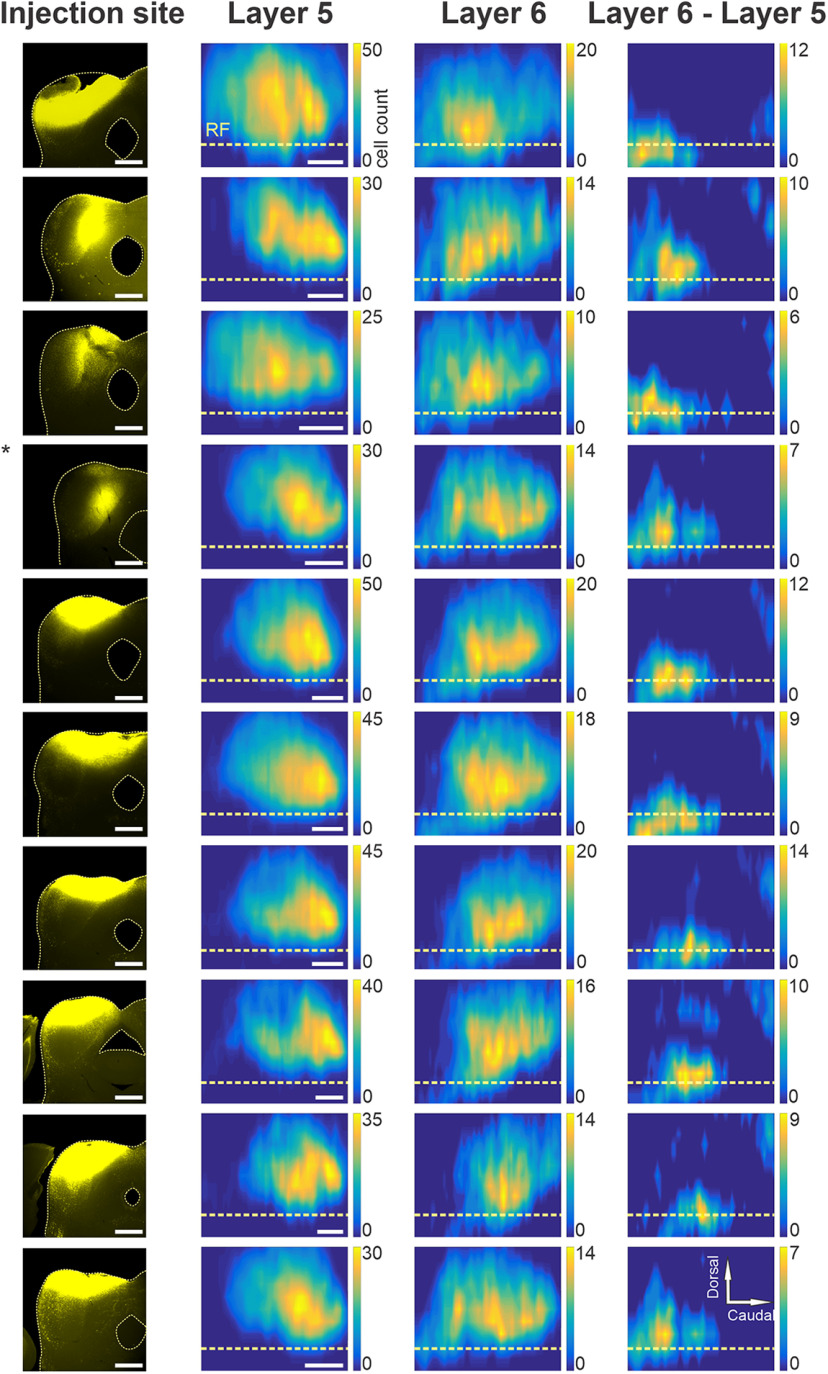
Figure 3.
Spatial distributions of layer 5 and 6 corticocollicular neurons. Each row includes data from one animal. The first column includes the injection sites of Fluoro-Gold into the left IC of each animal. The second column shows the distribution of layer 5 corticocollicular neurons in the cortex, while the third column has the corresponding distributions of layer 6 corticocollicular neurons. The final column shows the difference (layer 6 – layer 5). The compass in the top right corner describes the directionality for the maps. Scale bar, 250 μm.

