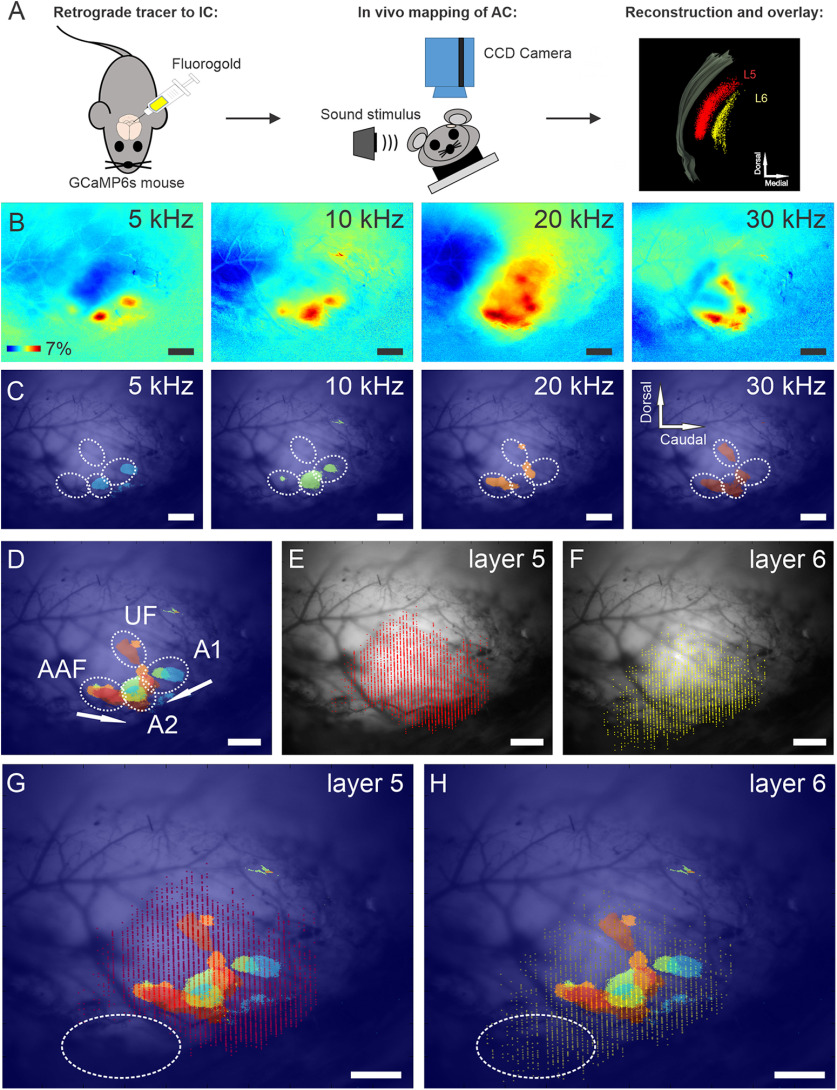
Figure 5.
Functional maps and corresponding distributions of layer 5 and layer 6 corticocollicular neurons in mouse AC. A, Illustration of experimental design for this figure and Figure 6. GCaMP6s mice were injected with Fluoro-Gold into the IC. The AC of the mice was then mapped using transcranial in vivo imaging. The distribution of layer 5 and layer 6 corticollicular neurons was reconstructed using Neurolucida and overlaid on the in vivo map. B–H, ΔF/F responses to 100% amplitude-modulated pure tones in mouse AC (B). B, C, A threshold level at 2.5 SDs was set to responses in B to display the peaks of stimulus-evoked cortical activity (C). C, D, Combination of cortical responses at threshold level from C identifies different auditory regions: tonotopically organized A1 and AAF, as well as A2 and UF (D). E, F, Reconstructions of layer 5 (E) and layer 6 (F) corticocollicular neurons for the same mouse. G, H, Overlays of the tonotopic map and corticocollicular reconstructions. Notice the absence of sound-evoked activity in the rostroventral to AC regions (highlighted in oval). Scale bar, 500 μm. Sound pressure levels: 5 kHz (70 dB SPL), 10 kHz (30 dB SPL), 20 kHz (29 dB SPL), and 30 kHz (50 dB SPL). N = 10 repetitions of each stimulus. Mean responses are displayed.

