Figure 3.

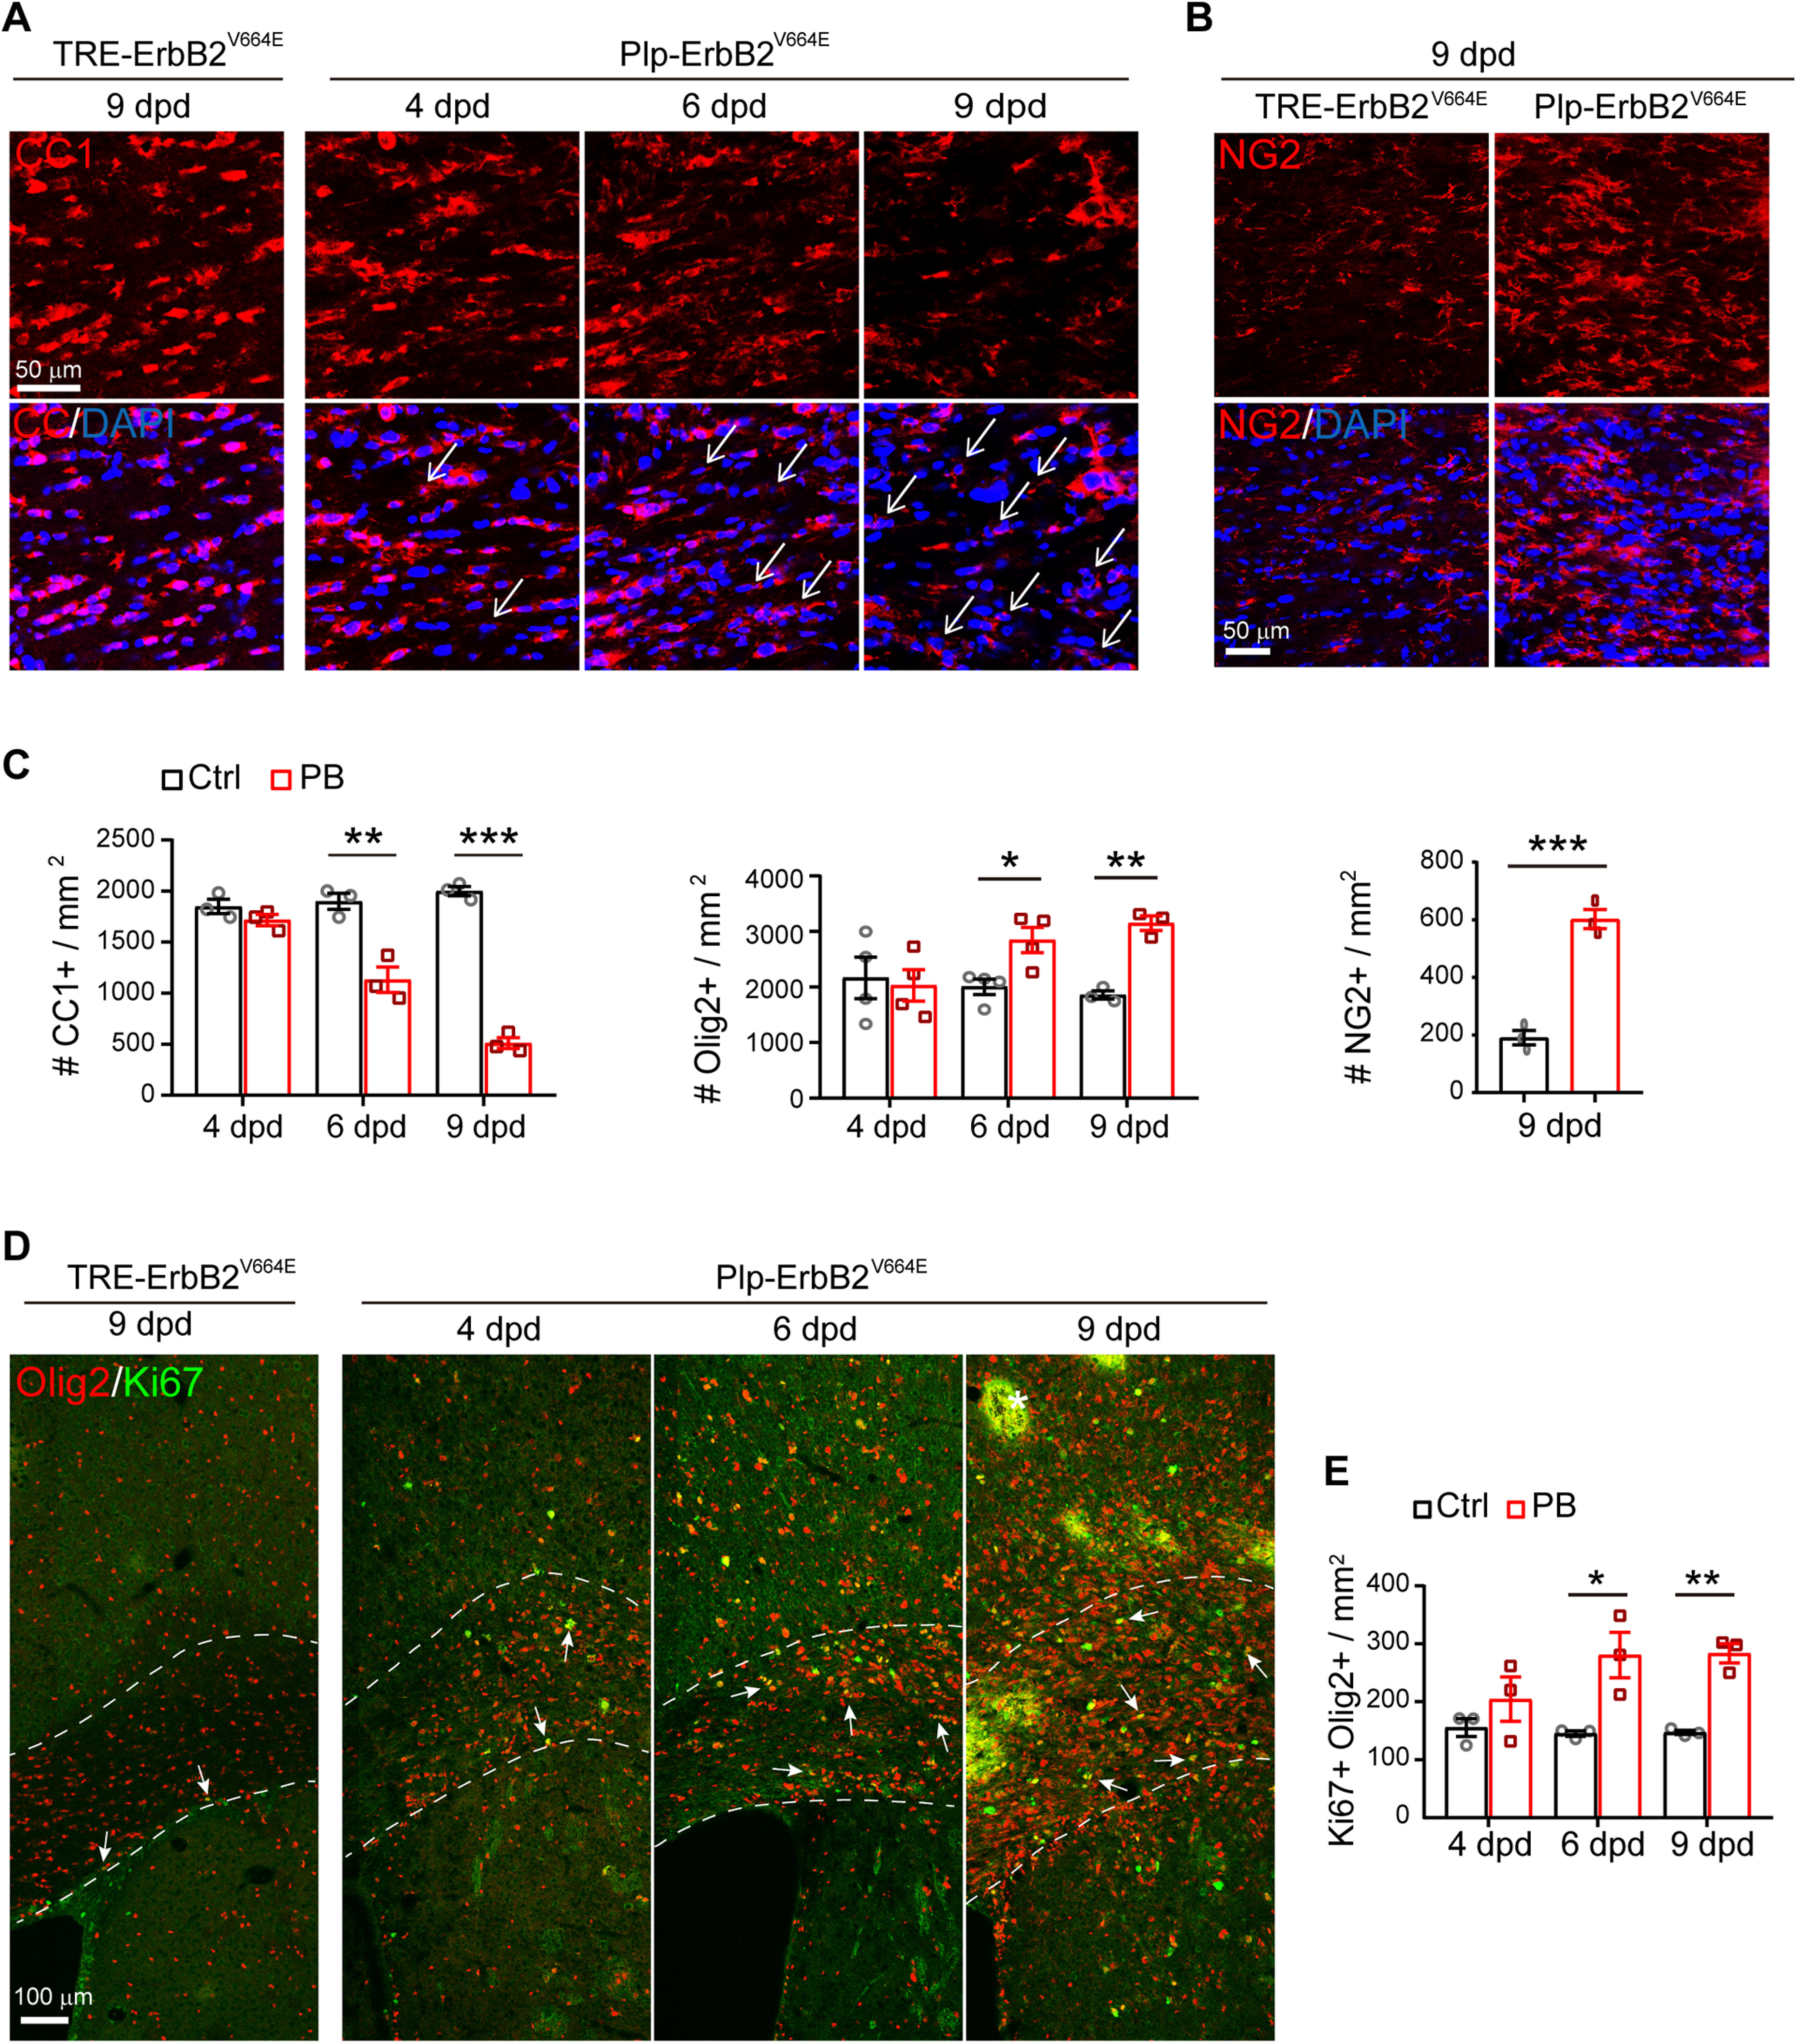
ErbB overactivation induced oligodendrocyte degeneration but OPC regeneration in Plp-ErbB2V664E mice. A, The numbers of degenerating oligodendrocytes (represented by nuclei associated with CC1+ cell debris, white arrows) increased in the corpus callosum of Plp-ErbB2V664E mice starting from 6 dpd as revealed by CC1 immunostaining. The densities of remained intact CC1+ cells were reduced. B, Immunostaining results of NG2 in the corpus callosum of indicated mice at 9 dpd. C, Quantitative data of immunostaining results in Plp-ErbB2V664E (PB) and control mice (Ctrl) with indicated Dox treatments were presented as mean ± SEM and analyzed by unpaired t test. For CC1+ density: at 4 dpd, t(4) = 1.485, p = 0.212; for 6 dpd, t(4) = 5.203, p = 0.0065; for 9 dpd, t(4) = 20.95, p < 0.0001. For Olig2+ density: at 4 dpd, t(6) = 0.2923, p = 0.780; at 6 dpd, t(6) = 3.16, p = 0.0196; at 9 dpd, t(4) = 8.563, p = 0.001. For NG2+ density at 9 dpd, t(4) = 9.912, p = 0.0006. D, Immunostaining results of Olig2 with Ki67 in the corpus callosum of indicated mice. Note there were nonspecifically stained hemorrhagic spots (white asterisk), which is the consequence of inflammation, in the brain slices from Plp-ErbB2V664E mice at 9 dpd. E, Quantitative data of Ki67+Olig2+ cell density in Plp-ErbB2V664E (PB) and control mice (Ctrl) with indicated Dox treatments were present as mean ± SEM and analyzed by unpaired t test. At 4 dpd, t(4) = 1.187, p = 0.301; at 6 dpd, t(4) = 3.428, p = 0.027; at 9 dpd, t(4) = 8, p = 0.0013. See also Extended Data Figure 3-1.
