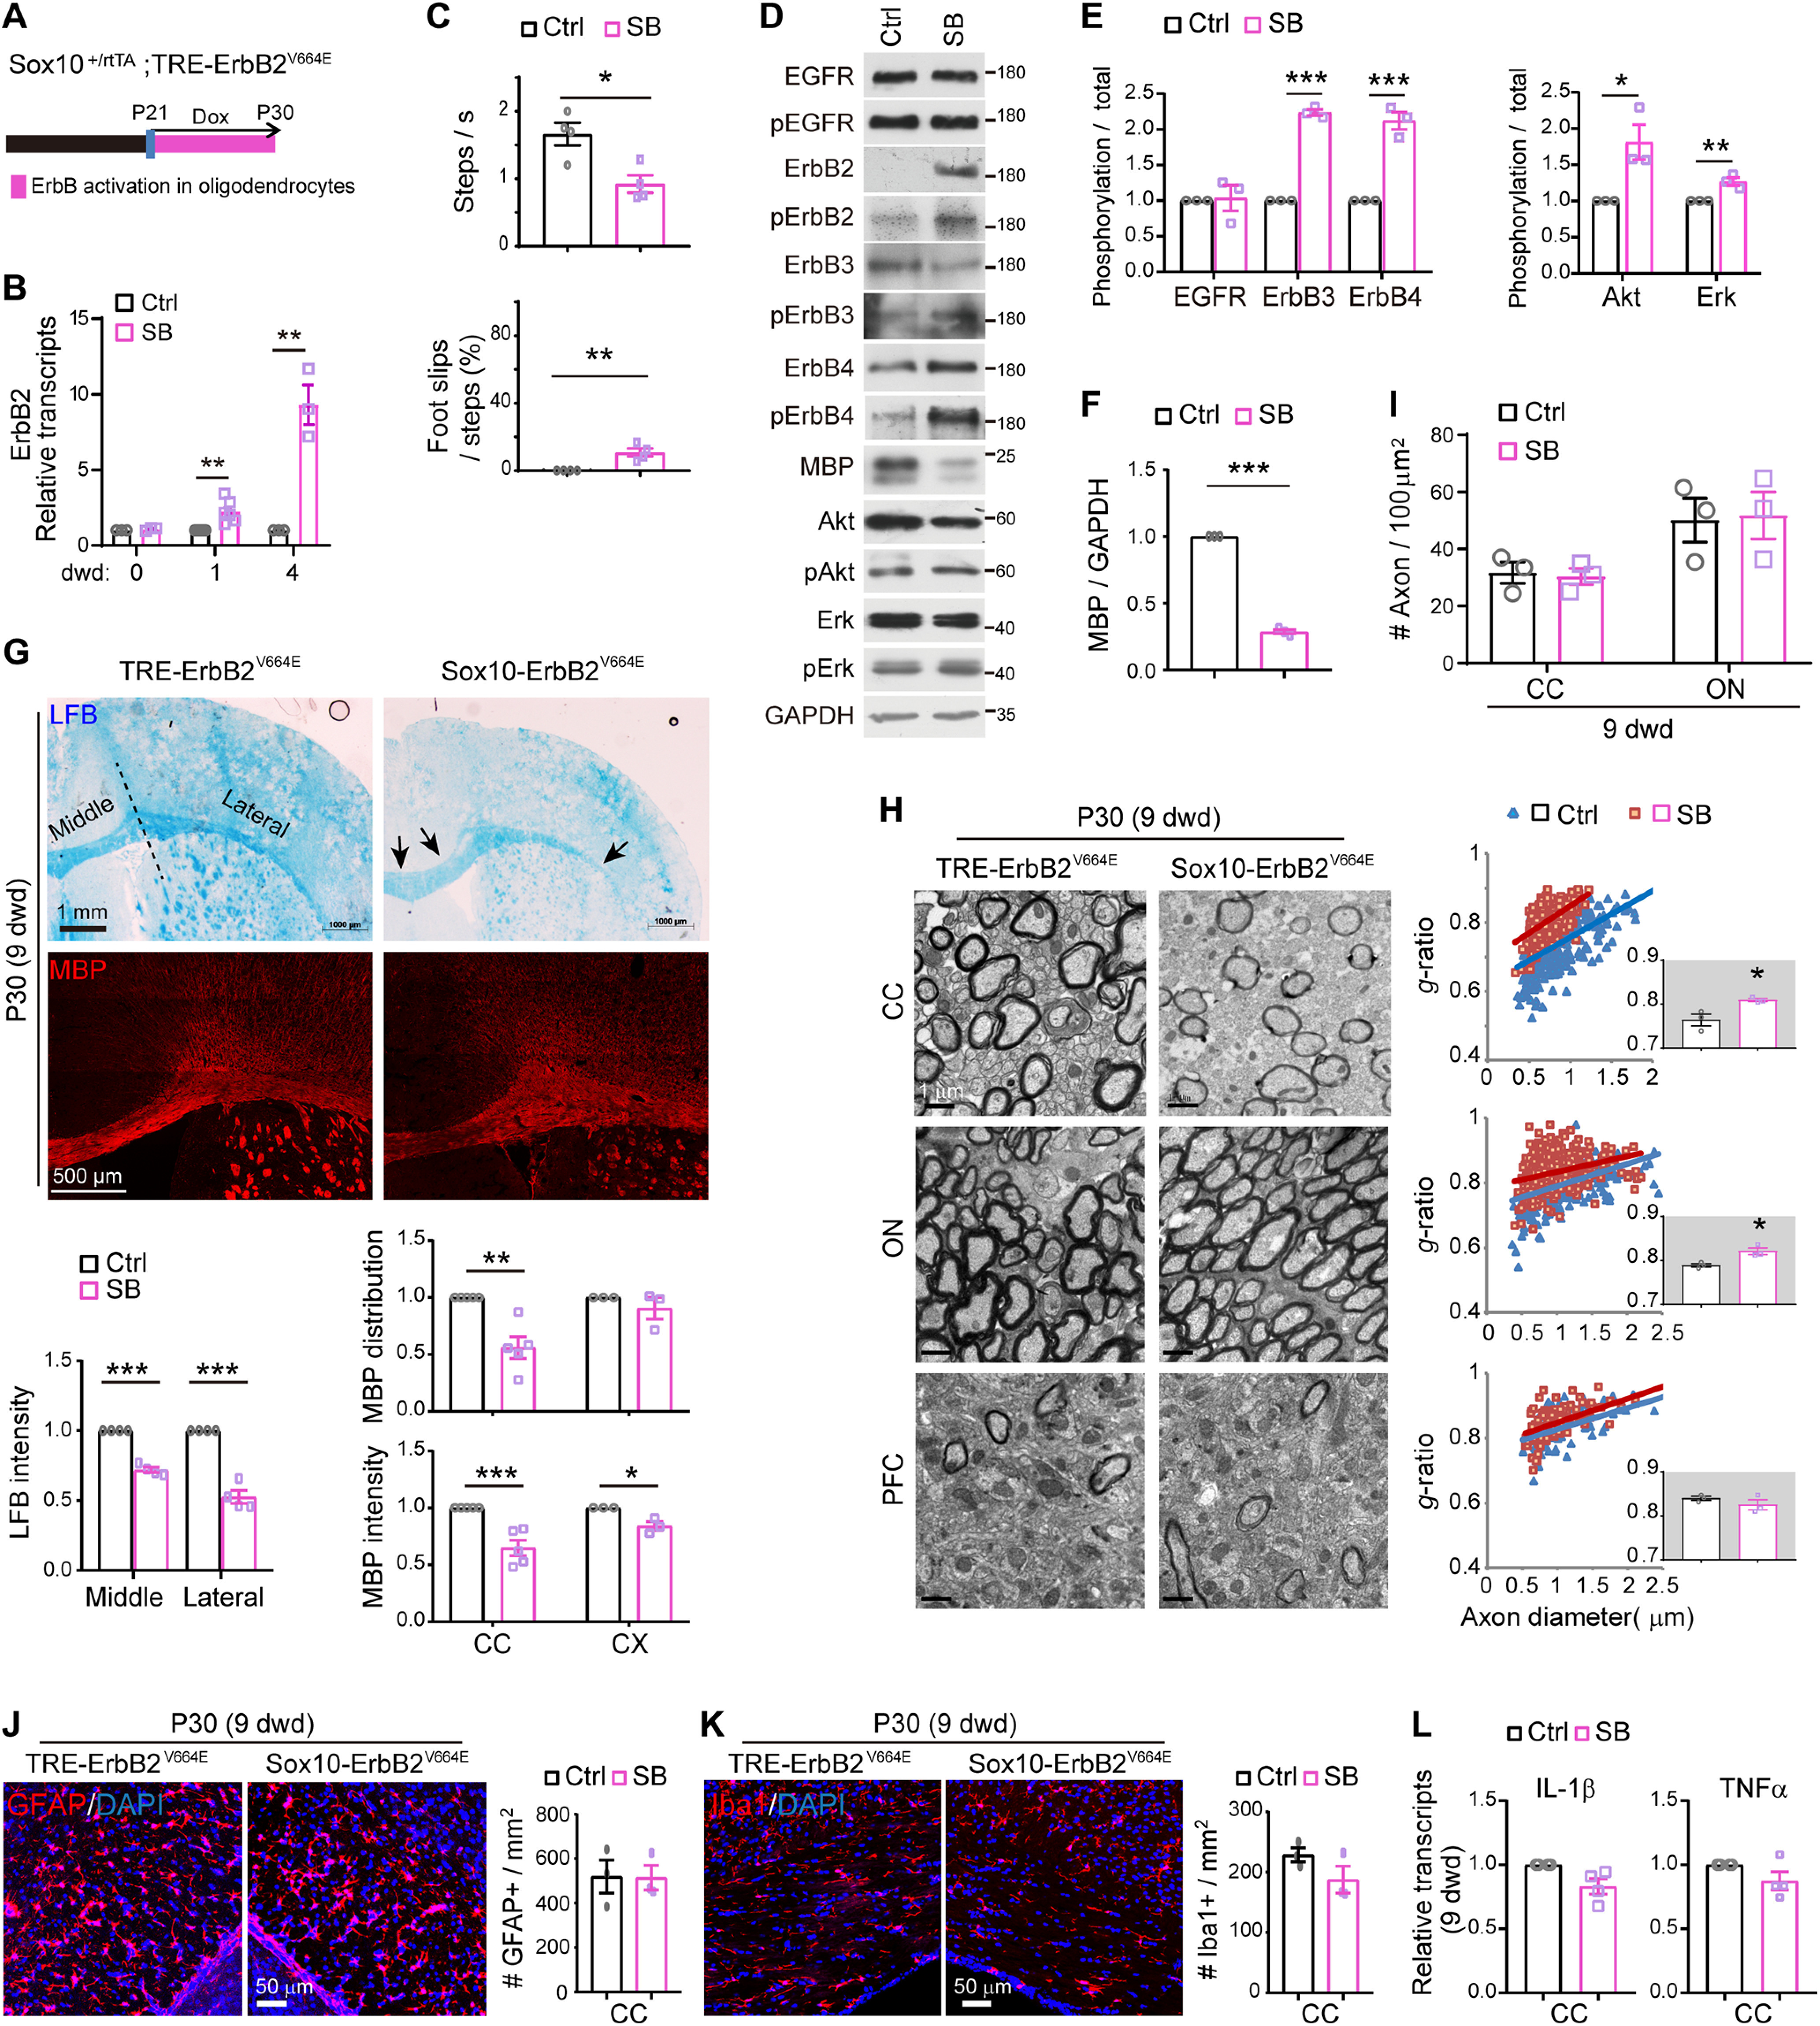
Figure 4.

ErbB overactivation caused noninflammatory hypomyelination in Sox10-ErbB2V664E mice. Unless otherwise indicated, quantitative data were presented as mean ± SEM and analyzed by unpaired t test. A, Dox treatment setting for indicated mice and littermate controls. B, Real-time RT-PCR results of ErbB2 expression at indicated day with Dox treatment (dwd). Statistical information for 1 dwd, t(10) = 4.081, p = 0.0022; for 4 dwd, t(4) = 6.37, p = 0.0031. C, Walking speed and percentage of foot slips of Sox10-ErbB2V664E mice and littermate controls at 9 dwd in the grid walking test. n = 4 mice for each group. Statistical information for steps per second, t(6) = 3.504, p = 0.0128; for foot slip percentage, t(6) = 4.429, p = 0.0044. D, Western blotting of indicated proteins in white matter tissues isolated from Sox10-ErbB2V664E (SB) mice in comparison with that from littermate control mice (Ctrl). Activation status of each ErbB receptor or downstream signaling protein was examined by Western blotting with the specific antibody against its phosphorylated form. E, F, Quantitative data of Western blotting results. In E, statistical information for EGFR, t(4) = 0.1983, p = 0.852; for ErbB3, t(4) = 28.34, p < 0.0001; for ErbB4, t(4) = 9.181, p = 0.00078; for Akt, t(4) = 3.380, p = 0.028; for Erk, t(4) = 4.899, p = 0.008. In F, for MBP, t(4) = 48.82, p < 0.0001. G, LFB staining and MBP immunostaining results of coronal sections through the genu of the corpus callosum (CC) in Sox10-ErbB2V664E (SB) and control mice (Ctrl). Black arrows indicate the lower staining intensity of myelin stained in the CC. Statistical information for quantitative data of LFB intensity: the middle part, t(6) = 15.17, p < 0.0001; the lateral part, t(6) = 10.23, p < 0.0001. Statistical information for MBP intensity: CC, t(8) = 5.14, p = 0.0009; CX, t(4) = 4.091, p = 0.015. Statistical information for MBP distribution: CC, t(8) = 4.622, p = 0.0017; CX, t(4) = 0.997, p = 0.375. H, EM images of the CC, optic nerve (ON), and prefrontal cortex (PFC) from Sox10-ErbB2V664E and littermate controls at 9 dwd. Quantitative data were shown for g-ratio analysis of myelinated axons detected by EM. Averaged g-ratio for each mouse were plotted as insets, presented as mean ± SEM, and analyzed by unpaired t test. For CC, t(4) = 3.295, p = 0.0301; for ON, t(4) = 3.775, p = 0.0195; for PFC, t(4) = 1.196, p = 0.298. I, The densities of myelinated axons examined by EM in different brain regions of Sox10-ErbB2V664E (SB) and littermate control mice (Ctrl) at 9 dwd were quantified. Statistical information for CC, t(4) = 0.2773, p = 0.795; for ON, t(4) = 0.1455, p = 0.891. J, K, Astrocytes (GFAP+) and microglia (Iba1+) examined in the subcortical white matter of indicated mice by immunostaining. Cell densities in the CC were quantified, and data were presented as mean ± SEM and analyzed by unpaired t test. In J, t(4) = 0.0501, p = 0.962. In K, t(4) = 1.637, p = 0.178. L, Real-time RT-PCR results of IL-1β and TNFα transcripts in the CC. Data were presented as mean ± SEM and statistical analysis by unpaired t test revealed no differences. See also Extended Data Figure 4-1 as well as Extended Data Figures 1-1, 1-2.
