Figure 8.

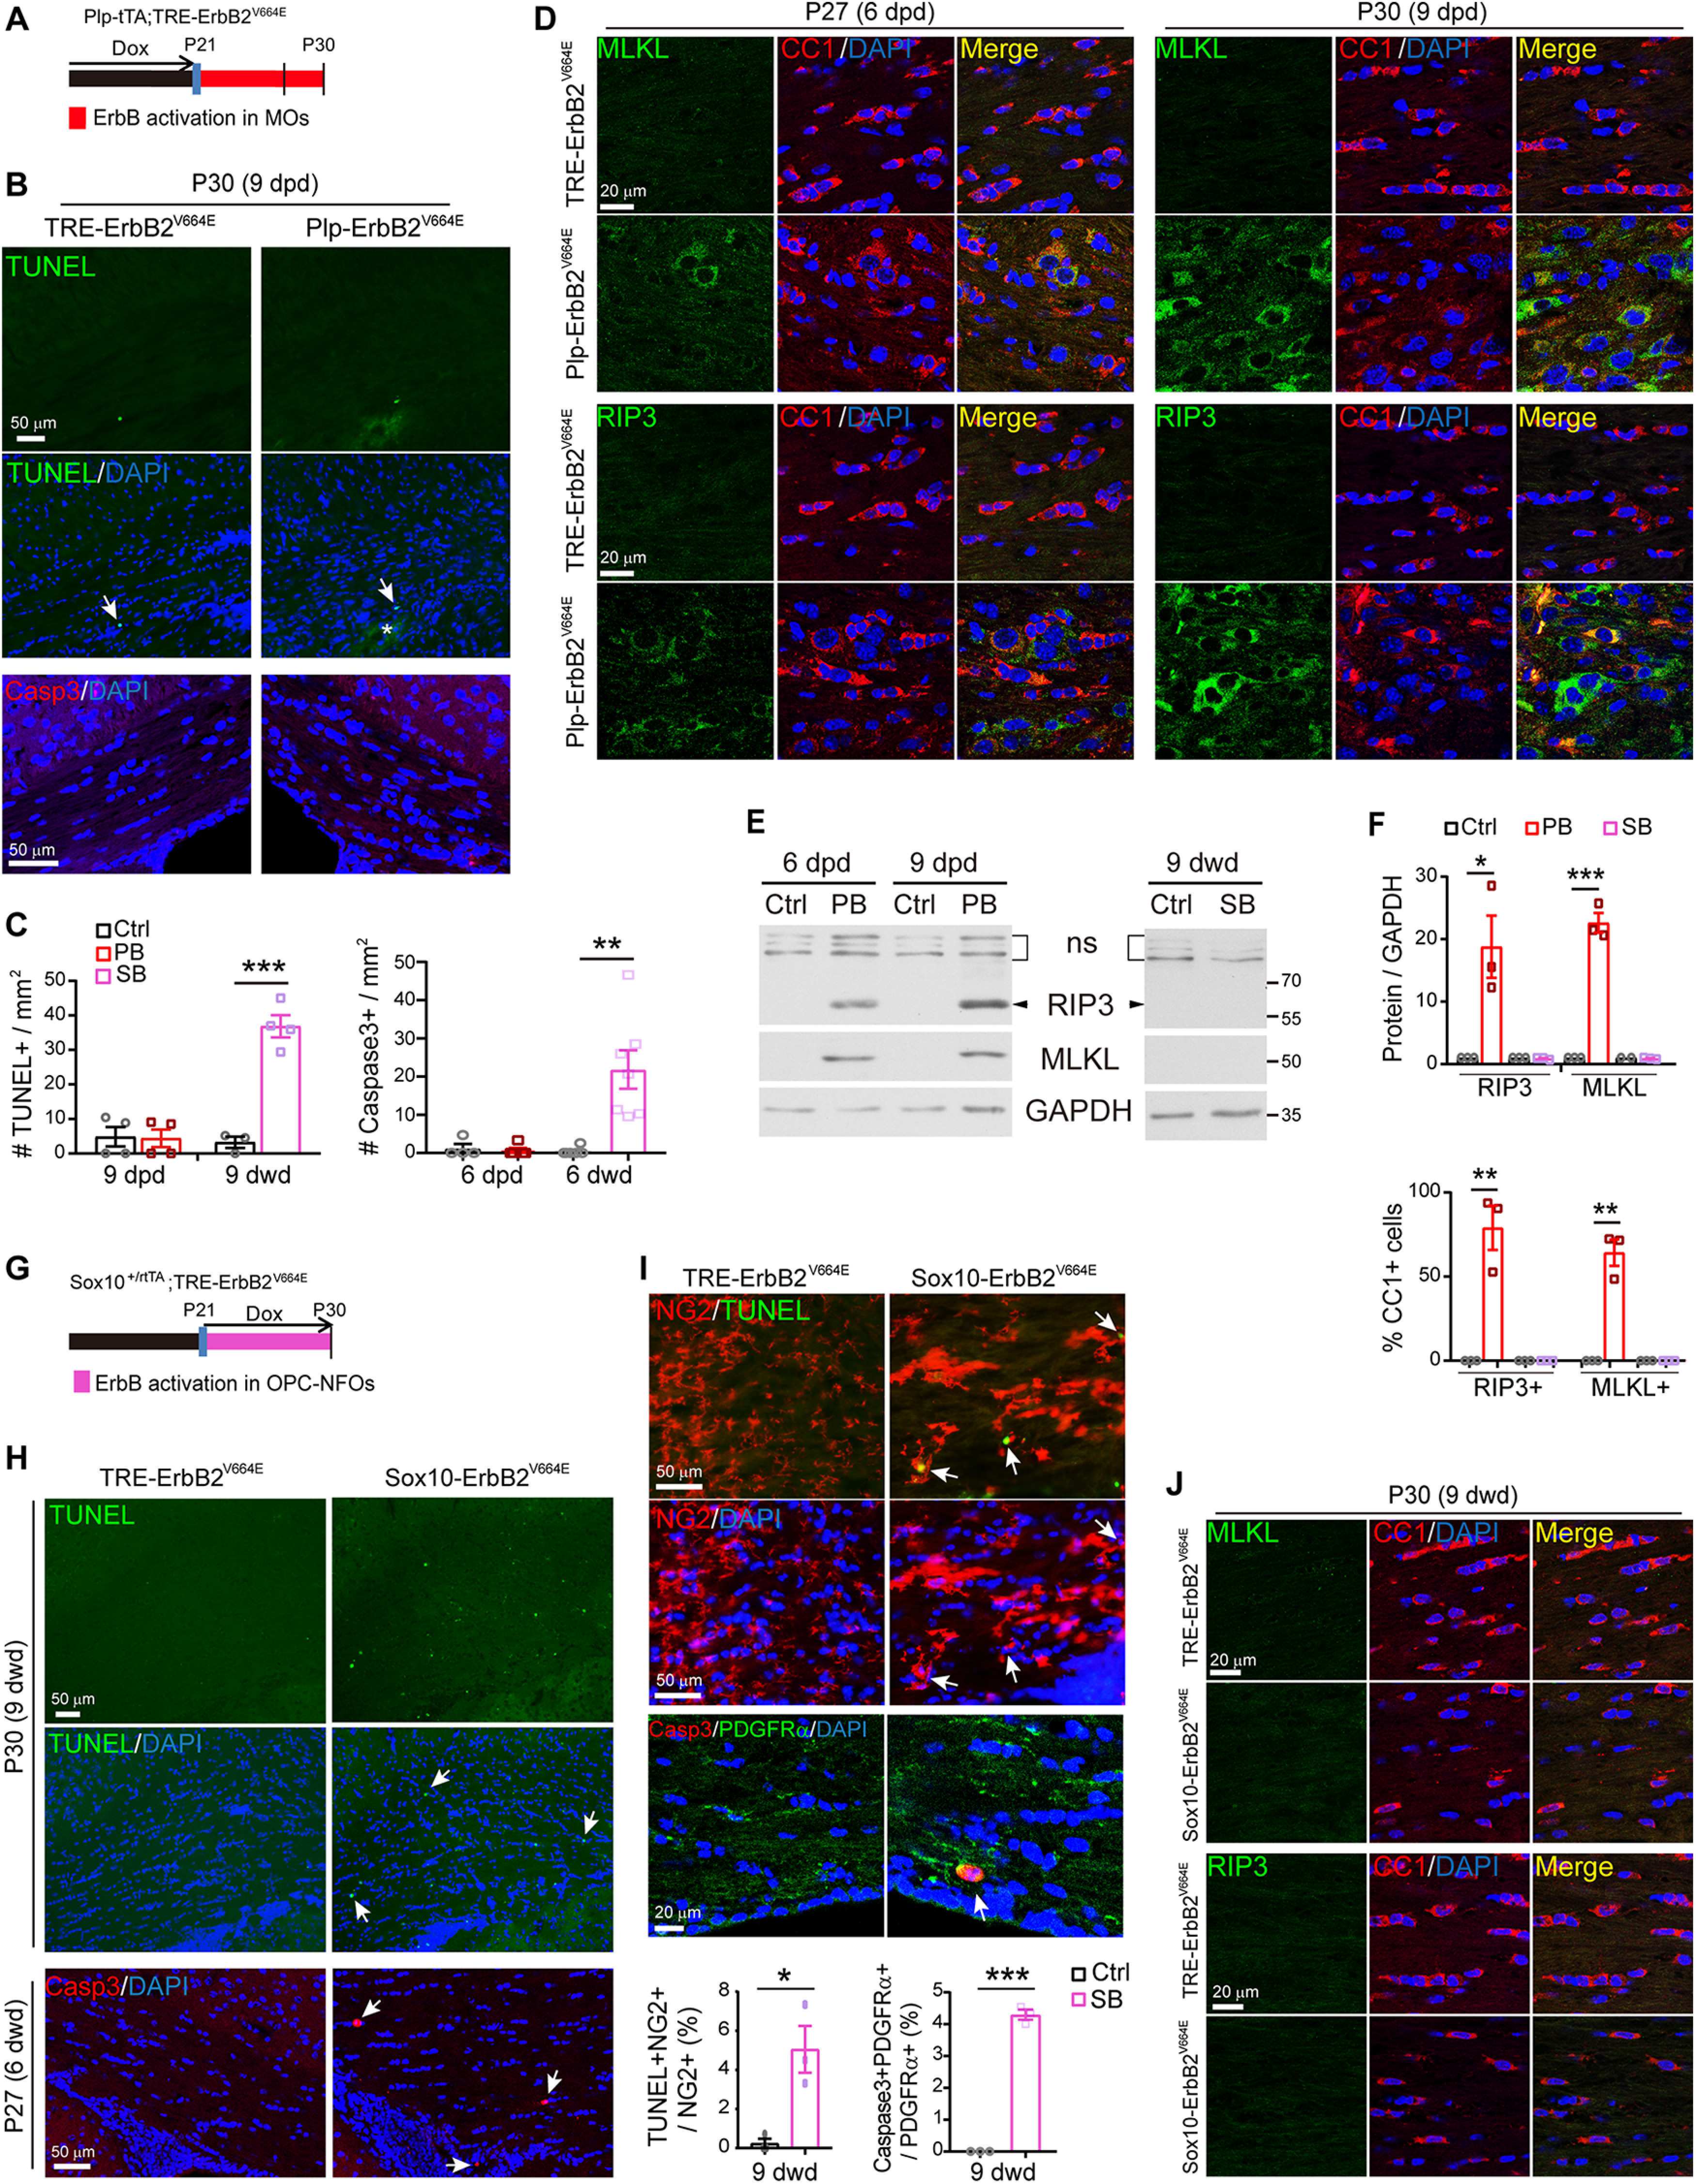
ErbB overactivation induced MO necroptosis in Plp-ErbB2V664E mice but OPC apoptosis in Sox10-ErbB2V664E mice. A, G, Dox treatment setting for indicated mice and littermate controls. B, H, Apoptotic cells (arrows) in the corpus callosum of Plp-ErbB2V664E and control mice at 9 dpd (B), or Sox10-ErbB2V664E and control mice at 6 or 9 dwd (H), were examined by TUNEL assays and immunostaining for cleaved caspase-3. Note the increased numbers of nuclei (DAPI+) and nonspecifically stained hemorrhagic spots (asterisk) in the brain slice of Plp-ErbB2V664E mice (B). C, Quantitative data of apoptotic cell densities in indicated mice. PB, Plp-ErbB2V664E. SB, Sox10-ErbB2V664E. Ctrl, control mice. Data were presented as mean ± SEM and analyzed by unpaired t test. For TUNEL assay: PB, t(6) = 0.1128, p = 0.914; SB, t(5) = 8.344, p = 0.0004. For caspase-3: PB, t(7) = 0.3959, p = 0.704; SB, t(11) = 3.893, p = 0.0025. D, J, Co-immunostaining results of MLKL or RIP3 with CC1 in the corpus callosum of indicated mice with indicated Dox treatments. E, Western blotting results of MLKL and RIP3 in the white matter of Plp-ErbB2V664E (PB) mice, or in that of Sox10-ErbB2V664E (SB) mice, and in those of littermate control mice (Ctrl). ns, nonspecific bands. F, Quantitative data of immunostaining and Western blotting results of MLKL or RIP3 in indicated mice at 9 d with Dox treatments. Data were presented as mean ± SEM and analyzed by unpaired t test. In Western blotting results, for RIP3 protein in PB, t(4) = 3.579, p = 0.023; for MLKL protein in PB, t(4) = 13.69, p = 0.00017. In immunostaining results, for percentage of RIP3+ in CC1+ cells in PB, t(4) = 6.002, p = 0.0039; for percentage of MLKL+ in CC1+ cells in PB, t(4) = 8.202, p = 0.0012. I, Apoptotic cells (TUNEL+ or cleaved caspase-3+) were OPCs (NG2+ or PDGFRα+) in Sox10-ErbB2V664E mice at P30 with 9 dwd. Arrows, representative double positive cells. Note OPCs in Sox10-ErbB2V664E mice were hypertrophic. The percentage of apoptotic OPCs in total OPCs were quantified and data were presented as mean ± SEM and analyzed by unpaired t test. For TUNEL+NG2+ cells, t(4) = 3.95, p = 0.0168. For Caspase3+PDGFRα+ cells, t(4) = 26.96, p < 0.0001.
