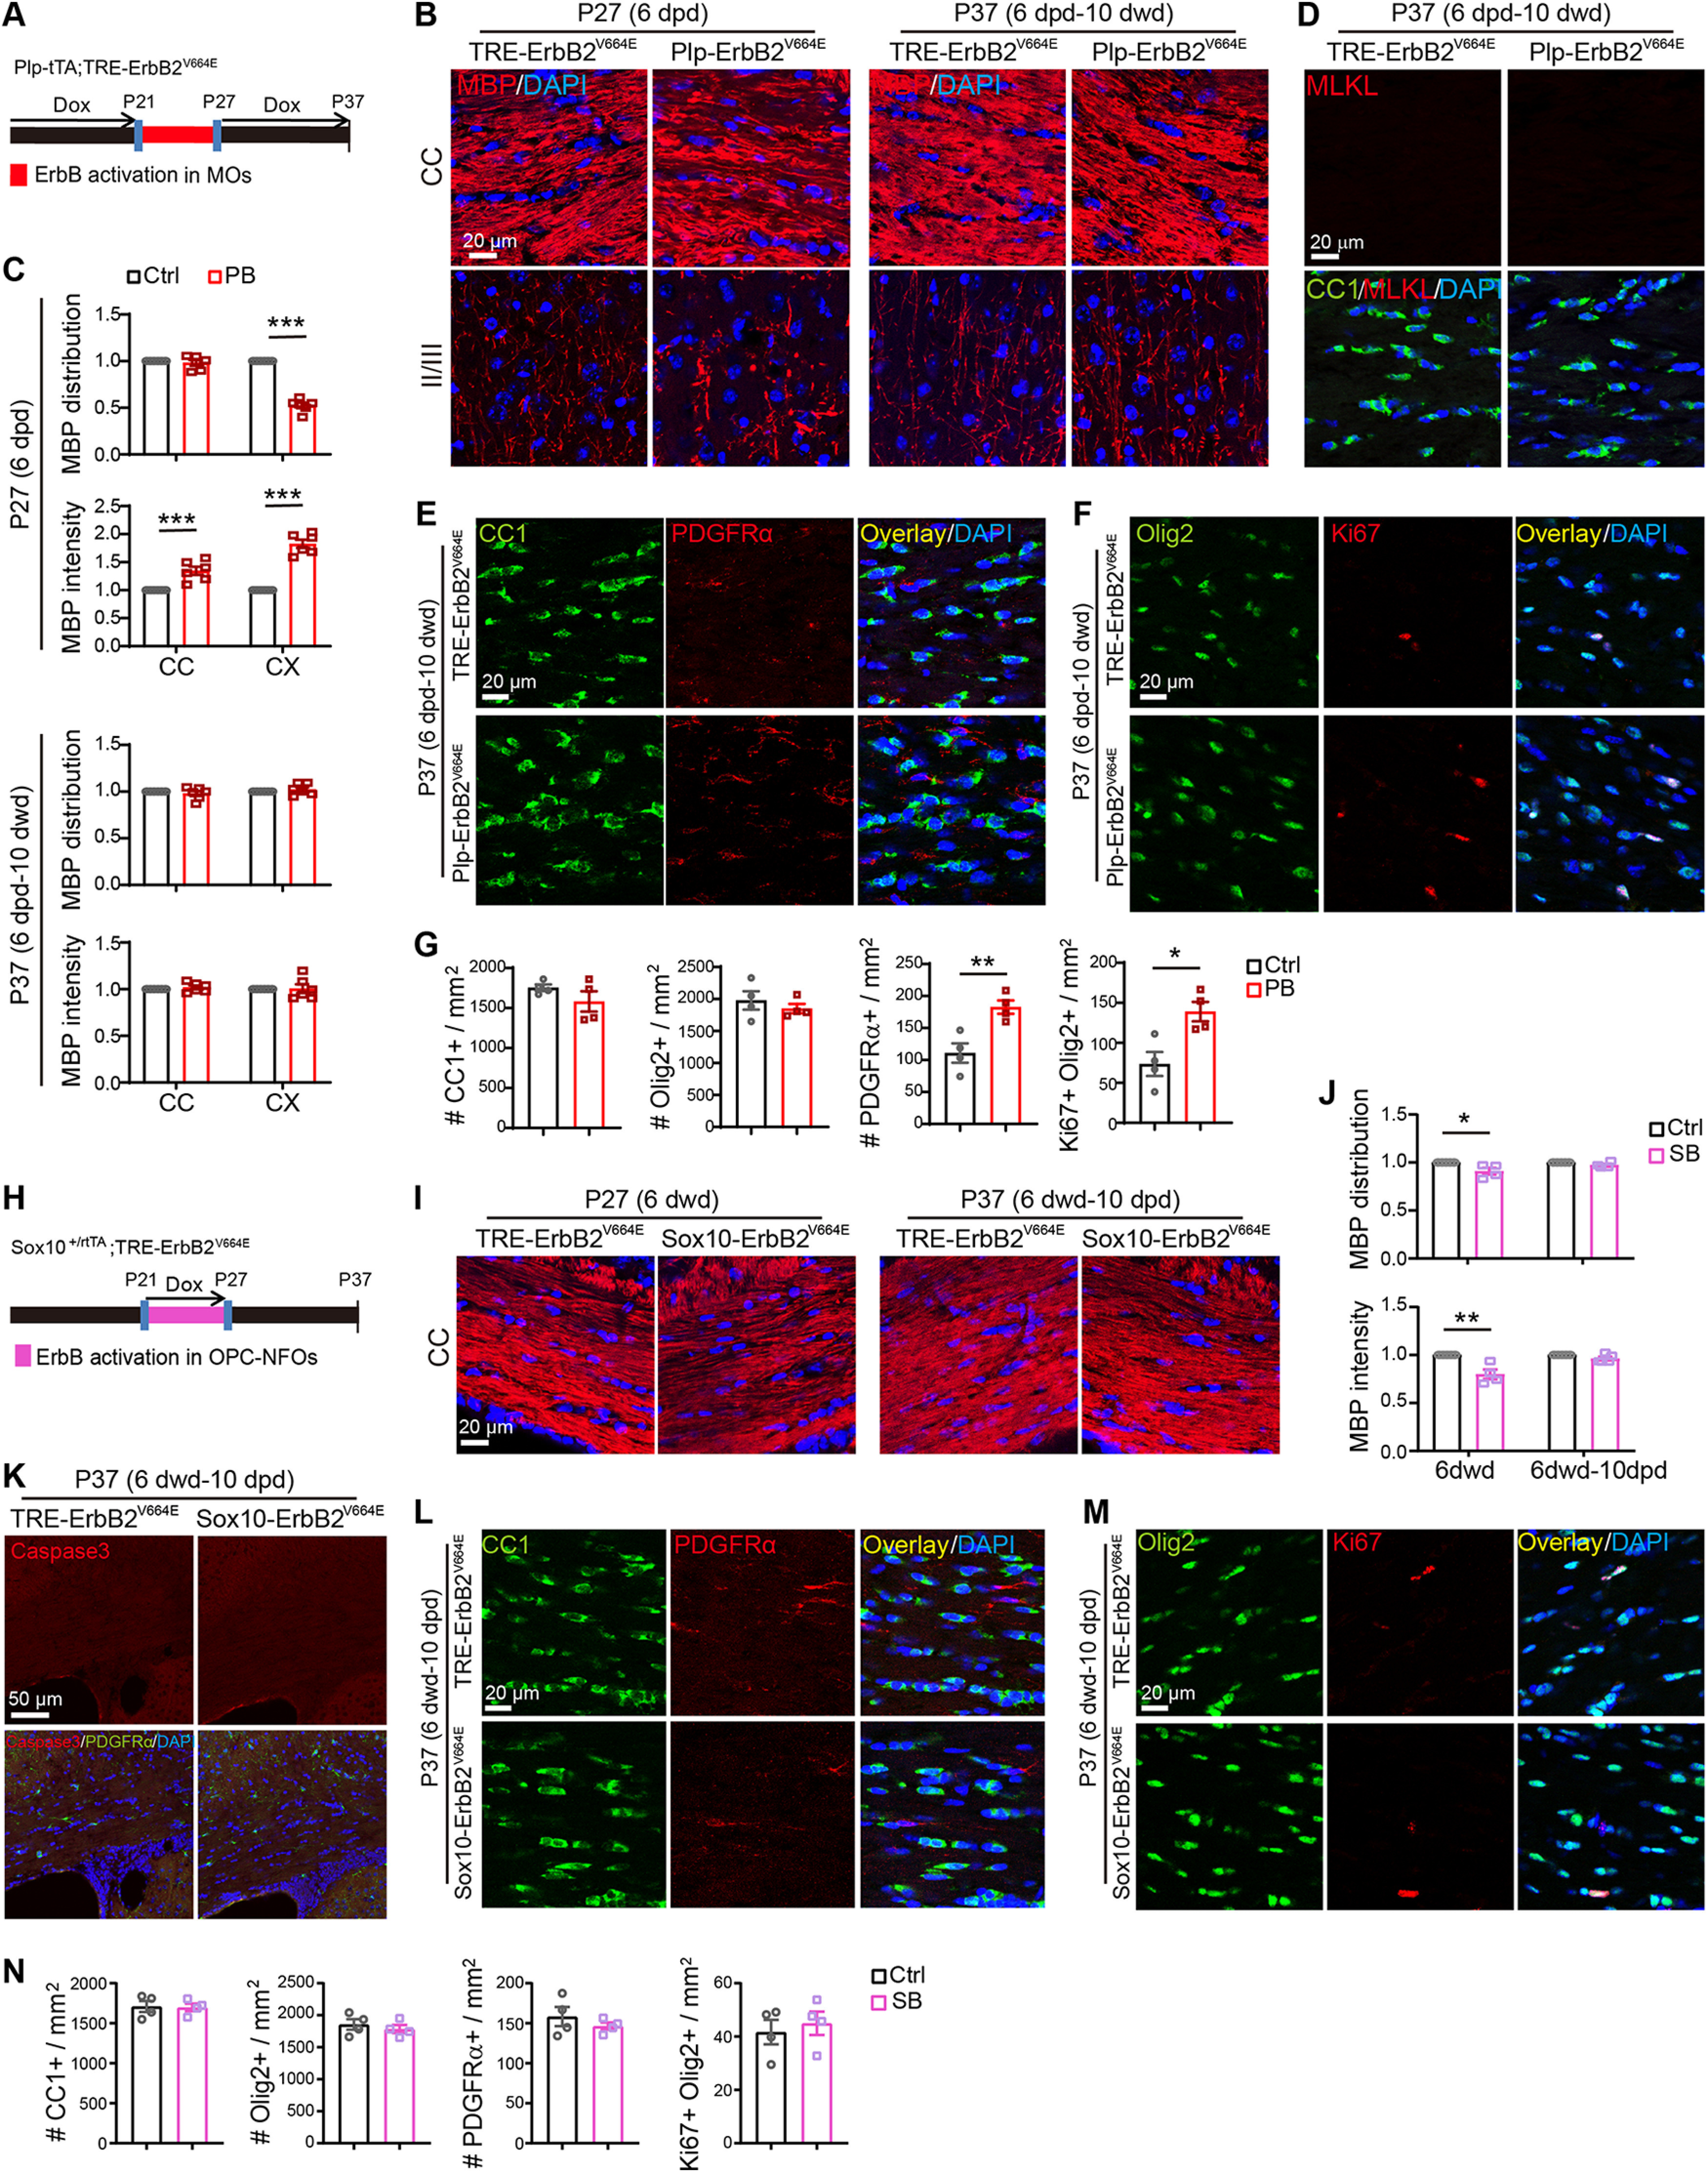
Figure 9.

Early intervention rescued pathologic phenotypes in both Plp-ErbB2V664E and Sox10-ErbB2V664E mice. Unless otherwise indicated, quantitative data were presented as mean ± SEM and analyzed by unpaired t test. A, H, Dox treatment setting for Plp-ErbB2V664E (PB) or Sox10-ErbB2V664E (SB) mice and littermate controls (Ctrl). B, I, MBP immunostaining of indicated mice with indicated Dox treatments. C, J, Quantitative data of MBP immunostaining results. Statistical information for PB at P27 (6 dpd) in C: MBP distribution of the corpus callosum (CC), t(10) = 0.6433, p = 0.534; the cortex (CX), t(10) = 16.67, p < 0.0001. MBP intensity of CC, t(10) = 4.72, p = 0.0008; CX, t(10) = 11.01, p < 0.0001. For PB at P37 (6 dpd–10 dwd) in C: MBP distribution of CC, t(10) = 0.7256, p = 0.485; CX, t(10) = 0.9144, p = 0.382. MBP intensity of CC, t(10) = 0.8559, p = 0.412; CX, t(10) = 0.09,778, p = 0.924. For the CC of SB in J: MBP distribution at P27 (6 dwd), t(7) = 2.93, p = 0.022; at P37 (6 dwd–10 dpd), t(7) = 1.979, p = 0.088. MBP intensity at P27 (6 dwd), t(7) = 4.478, p = 0.0029; at P37 (6 dwd–10 dpd), t(8) = 1.975, p = 0.084. D, K, No necroptotic (MLKL+) or apoptotic signals (cleaved caspase-3+) in Plp-ErbB2V664E (D) and Sox10-ErbB2V664E (K) mice, respectively, 10 d after Dox treatment switch. E, F, L, M, Representative immunostaining results of CC1, PDGFRα, Olig2, Ki67 in the CC of Plp-ErbB2V664E (E, F) and Sox10-ErbB2V664E (L, M) mice 10 d after Dox treatment switch. G, N, Quantitative data of oligodendrocyte densities in the CC. Statistical information for Plp-ErbB2V664E (PB) in G: for CC1+, t(6) = 1.288, p = 0.245; for Olig2+, t(6) = 0.7953, p = 0.457; for PDGFRα+, t(6) = 3.907, p = 0.0079; for Ki67+Olig2+, t(6) = 3.389, p = 0.0147. For Sox10-ErbB2V664E (SB) in N: for CC1+, t(6) = 0.1294, p = 0.901; for Olig2+, t(6) = 0.6954, p = 0.513; for PDGFRα+, t(6) = 0.9395, p = 0.384; for Ki67+Olig2+, t(6) = 0.5167, p = 0.624.
