
Figure 3.
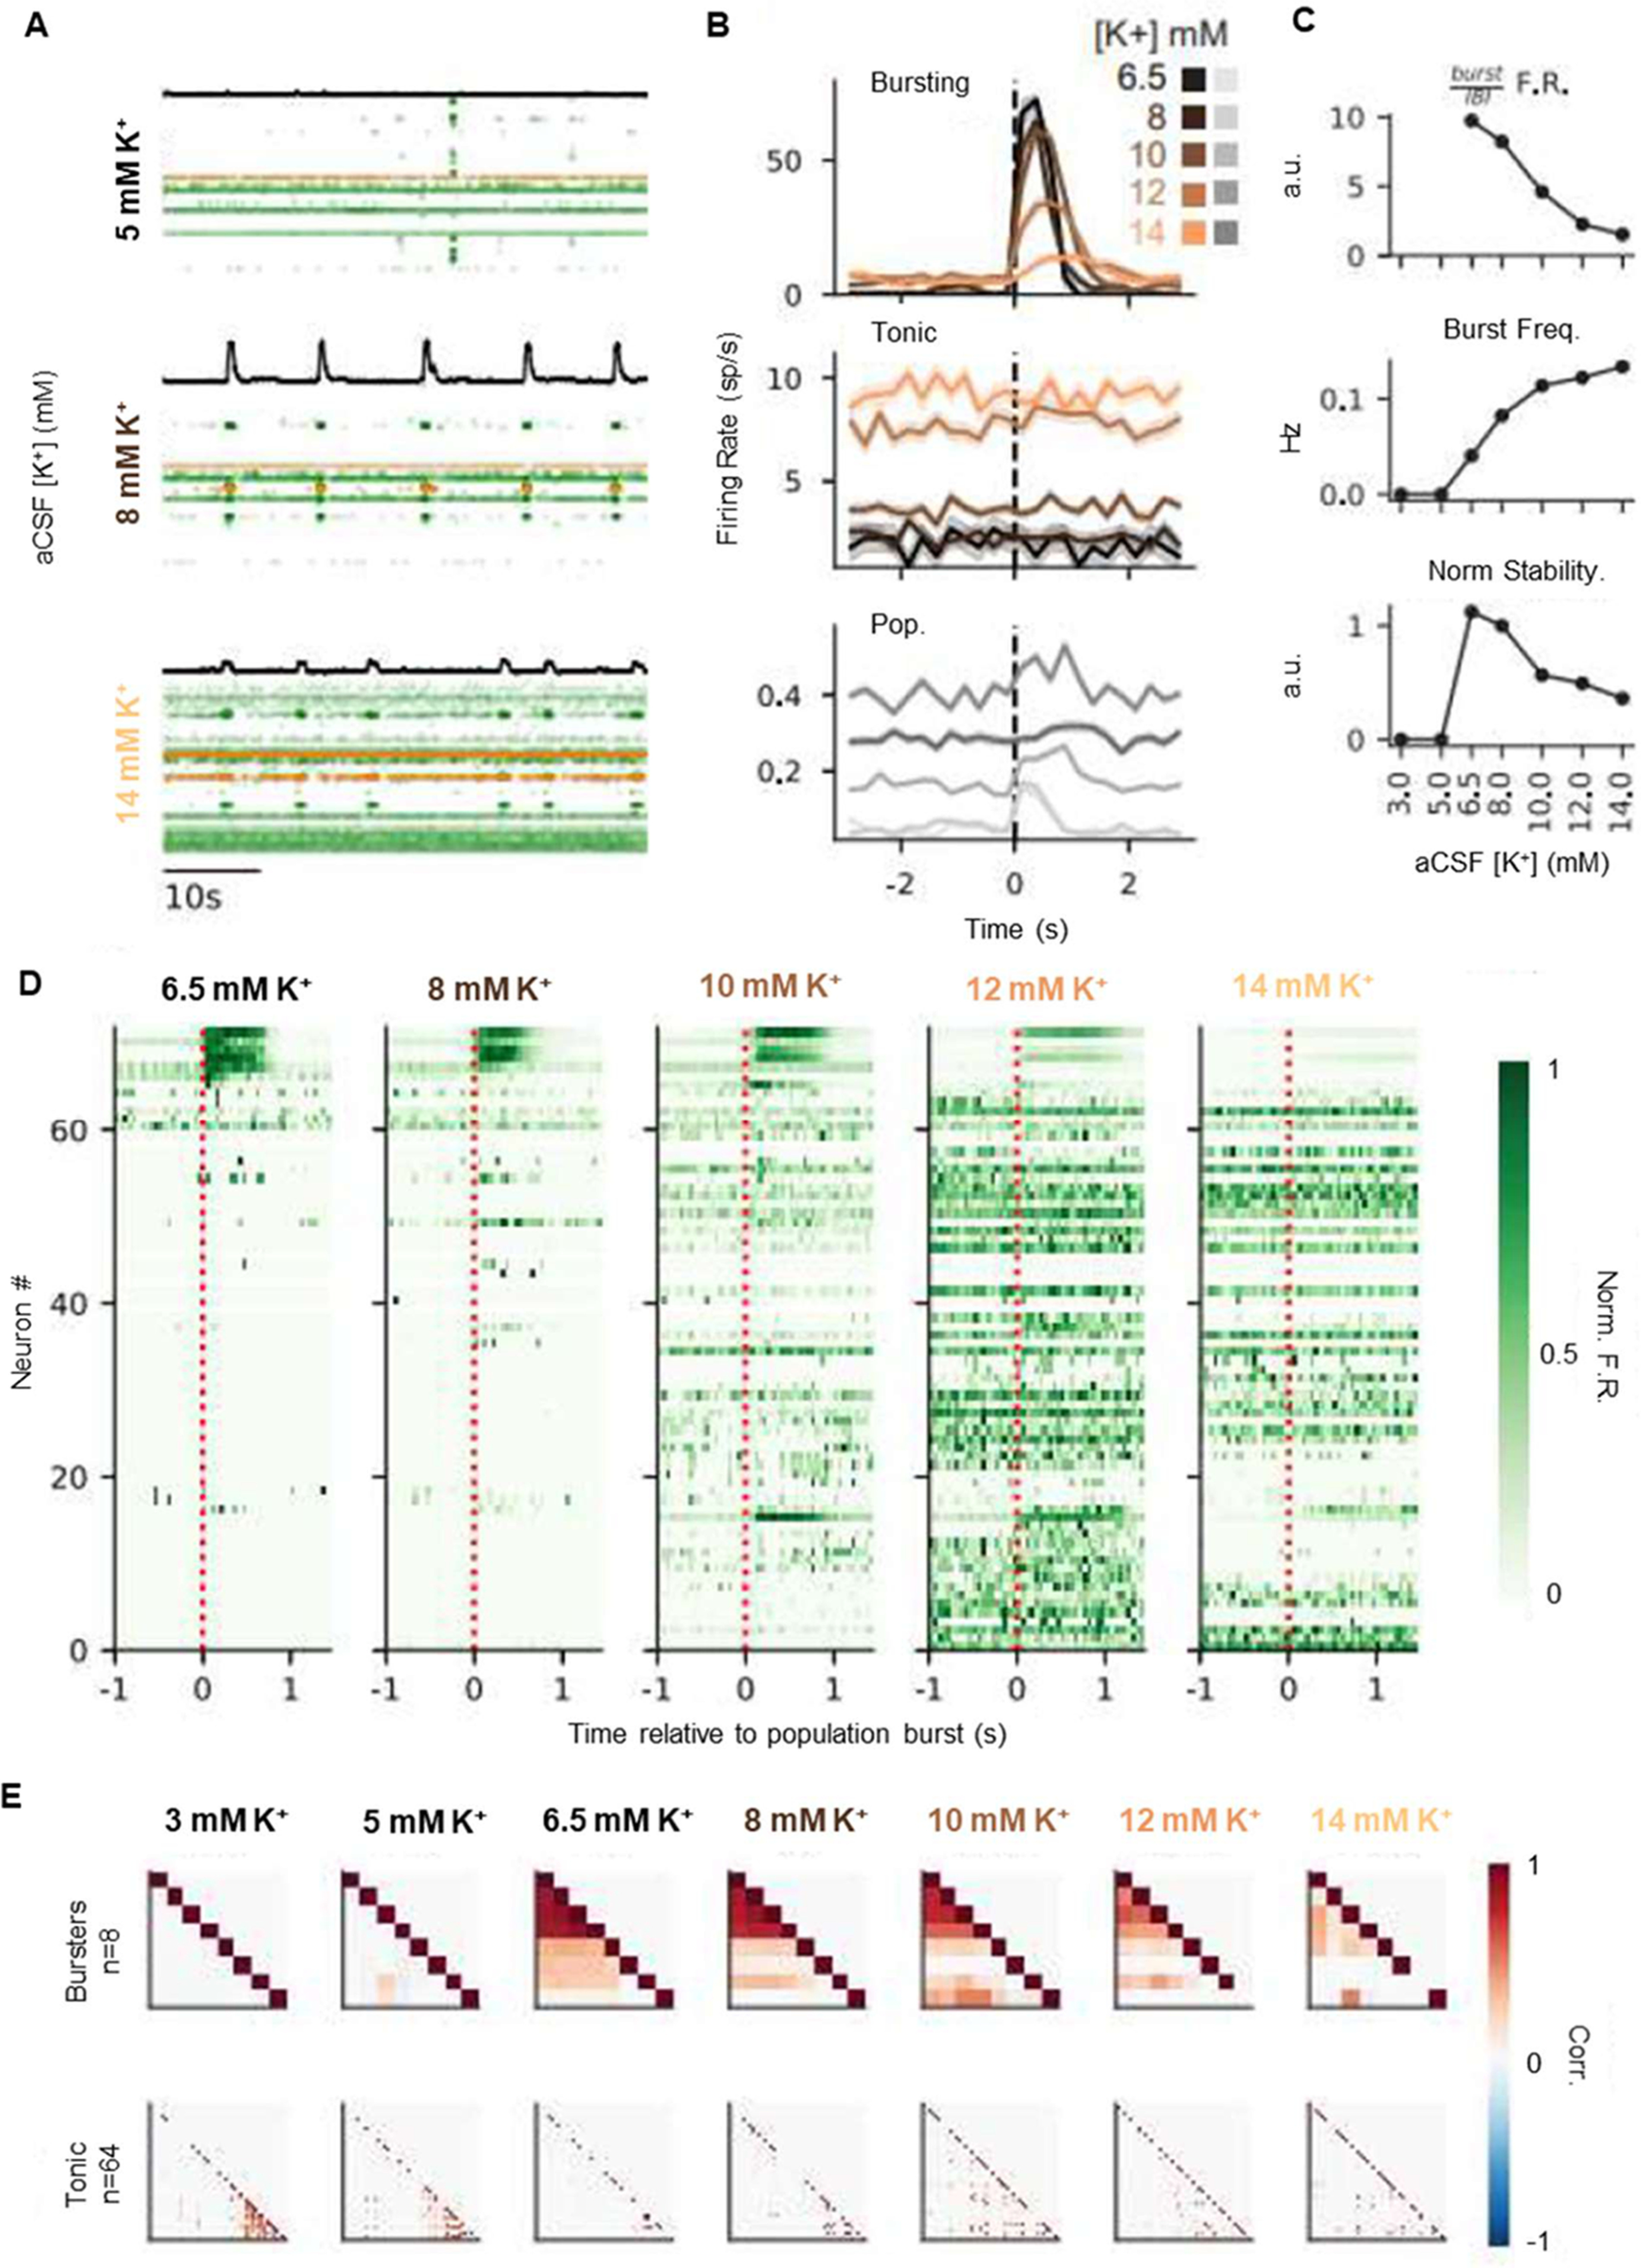
Changes in rhythm stability are associated with a trade-off between bursting and tonic spiking activity. A, Rasters of 72 simultaneously recorded single units at 5, 8, and 14 mm [K+]. Black trace is integrated contralateral population recording. Each row is a single neuron, and each dot is a recorded spike. Rows are ordered by recording depth. Cells highlighted in orange represent the tonic and bursting cell examples in B. B, Burst aligned spiking at each K+ concentration for a bursting (top) and tonic (middle) neuron (highlighted in A). Traces are average spikes/s over 10 min recordings for each K+ level, binned at 250 ms. Pooled spiking activity across all neurons is shown (bottom) in gray, where y-axis is spikes/s/neuron. Shaded regions are ± SE. Burst spiking decreases and tonic spiking increases as K+ increases; = (9,25,39,45,40) for K+ = (6.5,8,10,12,14) mm. C, Top, Ratio of burst firing rate (500 ms after burst onset) to interburst firing rate (1 s before burst onset) pooled across all neurons, as a function of K+. Middle, Burst frequency increases, and burst stability decreases (bottom) as [K+] increases. D, Burst aligned peristimulus time histograms of spike rate for each recorded neuron (rows), at each K+ concentration. Neurons are ordered by decreasing burst-related firing rate as observed at K+ = 6.5 mm. Spike rates are normalized by the maximal firing rate of each neuron. E, Top, Pairwise correlations between bursting and tonic (bottom) neurons for each K+ level. Neurons are clustered by Ward linkage at 6.5 mm K+ (bursters) or 3 mm (tonic).