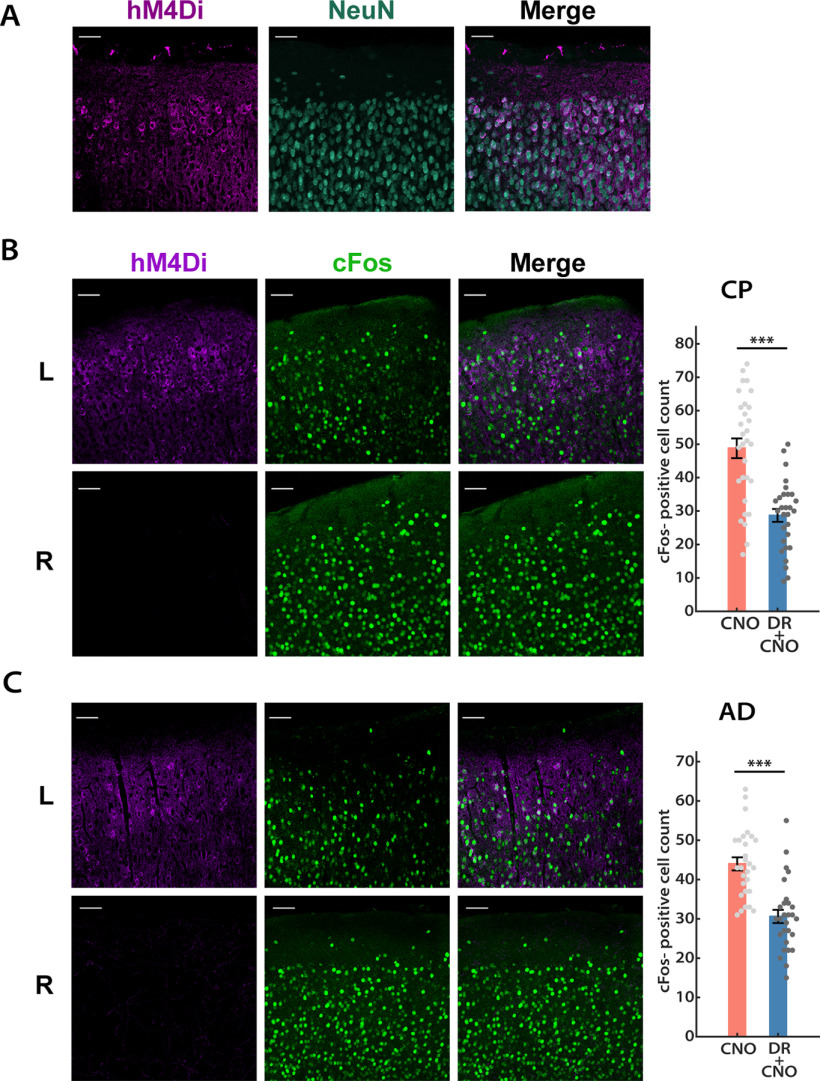
Figure 1.
DREADD-mediated acute activity suppression in mouse V1. A, Representative images of DREADD expression pattern in the L2/3 of mouse V1. Left, DREADD+ neurons (violet); middle, NeuN (teal); right, overlay. Scale bar, 50 µm. B, C, Acute effects (1 h) of DREADD-mediated network activity suppression were comparable in juvenile (B, CP) and adult (C, AD) mice. Left, DREADD+ cells (magenta); middle, c-Fos signals (green); right, overlay. Bar plots, Numbers of c-Fos+ cells detected in L2/3 for both hemispheres, each data point indicates cells detected in an ROI from a single slice (unpaired t test: CP, p = 1.09E-5; AD, p = 2.05E-6). Scale bar, 50 µm. Sample sizes: CP: n = 30, 4 animals; AD, n = 28, 3 animals.

