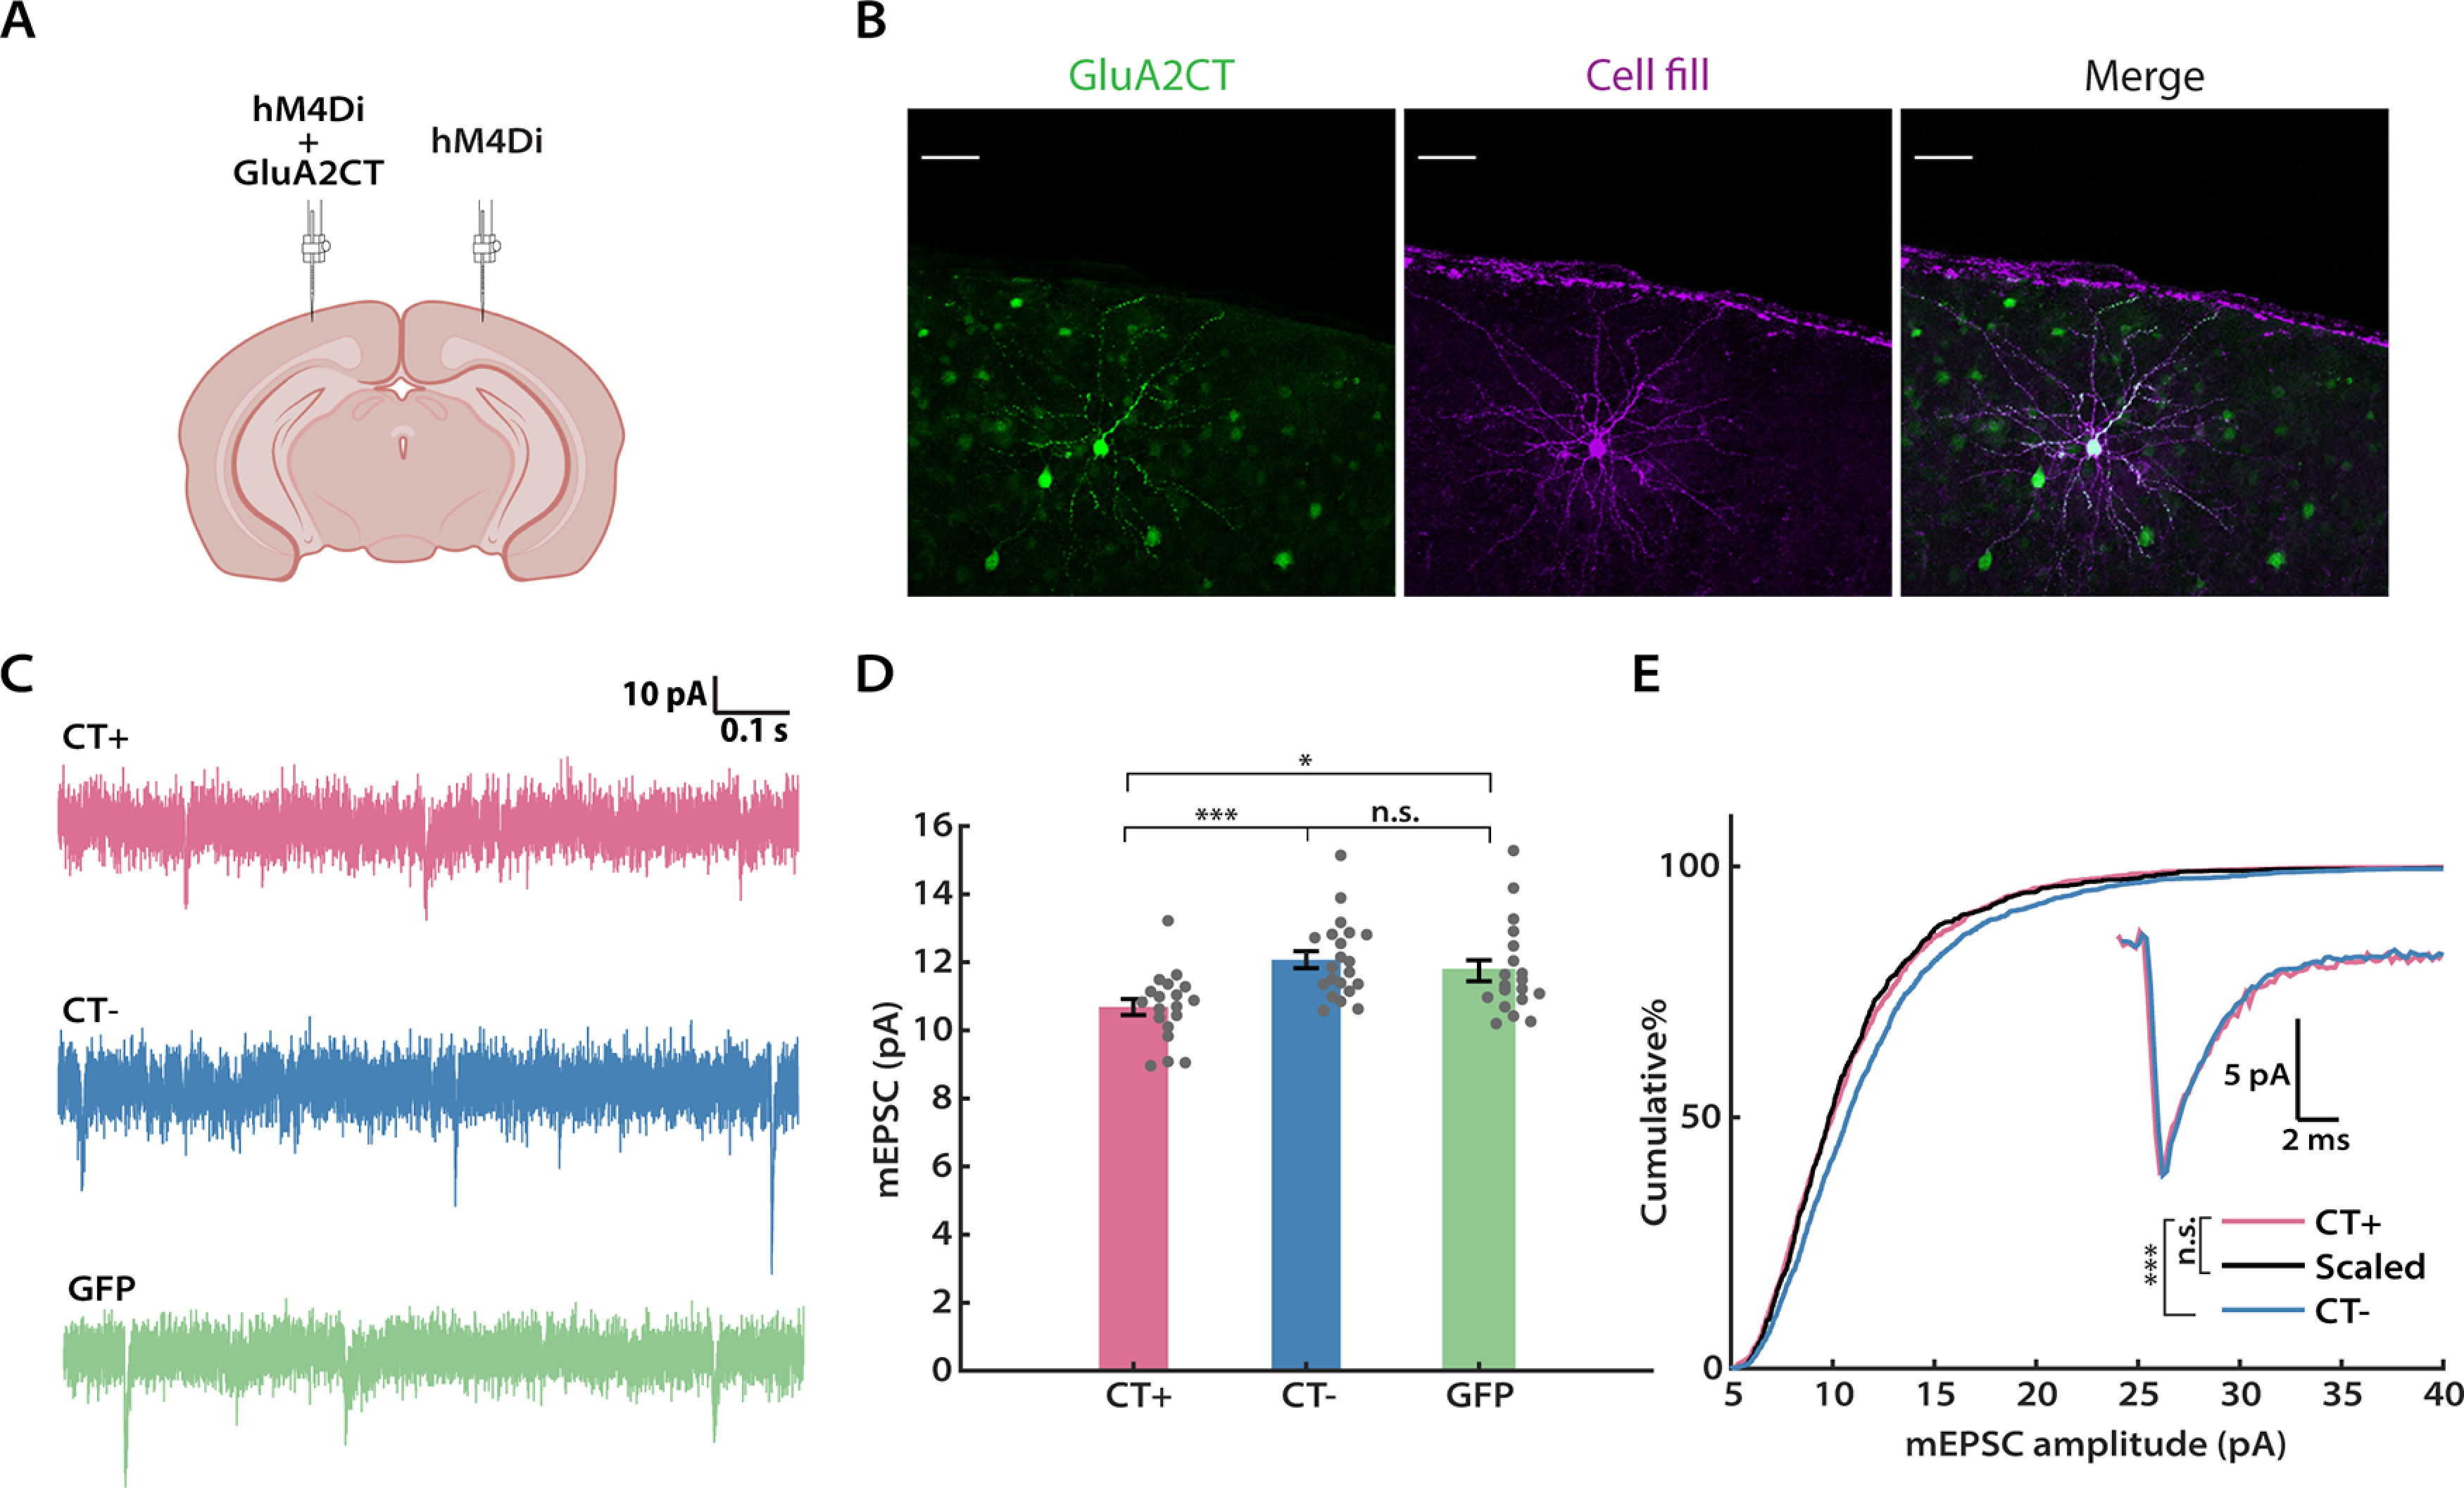
Figure 3.

DREADD-induced synaptic scaling is blocked by the GluA2 C-tail. A, A schematic of the experimental design (adapted from icons on BioRender.com). Viruses expressing hM4Di and the GluA2 C-tail, or hM4Di alone, were delivered to the left and right hemispheres of V1, respectively. B, Representative images of GluA2 C-tail expression and biocytin cell fill from a L2/3 pyramidal neuron. C, Representation mEPSC traces from hM4Di+ neurons after CNO administration, with or without the GluA2 CT (CT+ and CT–), or GFP. Scale bar, 50 µm. D, Comparison of the mean mEPSC amplitude from each condition (Kruskal–Wallis test followed by Tukey's post hoc correction, CT+ vs CT–, p = 0.0008; CT+ vs GFP, p = 0.0388; CT– vs GFP: p = 0.4924). E, Cumulative distributions of mEPSC amplitudes for the indicated conditions. Events from the CT– condition were scaled according to the linear function y = 1.21× – 1.10 (black trace). Similarly, two distributions are not significantly different after scaling (Kolmogorov–Smirnov test: CT+ vs CT–, p = 5.28E-9; CT+ vs Scaled, p = 0.4355). Inset, Overlay of peak-scaled waveform average traces from all three conditions, to illustrate mEPSC kinetics. Sample sizes: CT+: n = 19, 7 animals; CT–, n = 21, 7 animals; GFP: n = 19, 6 animals.
