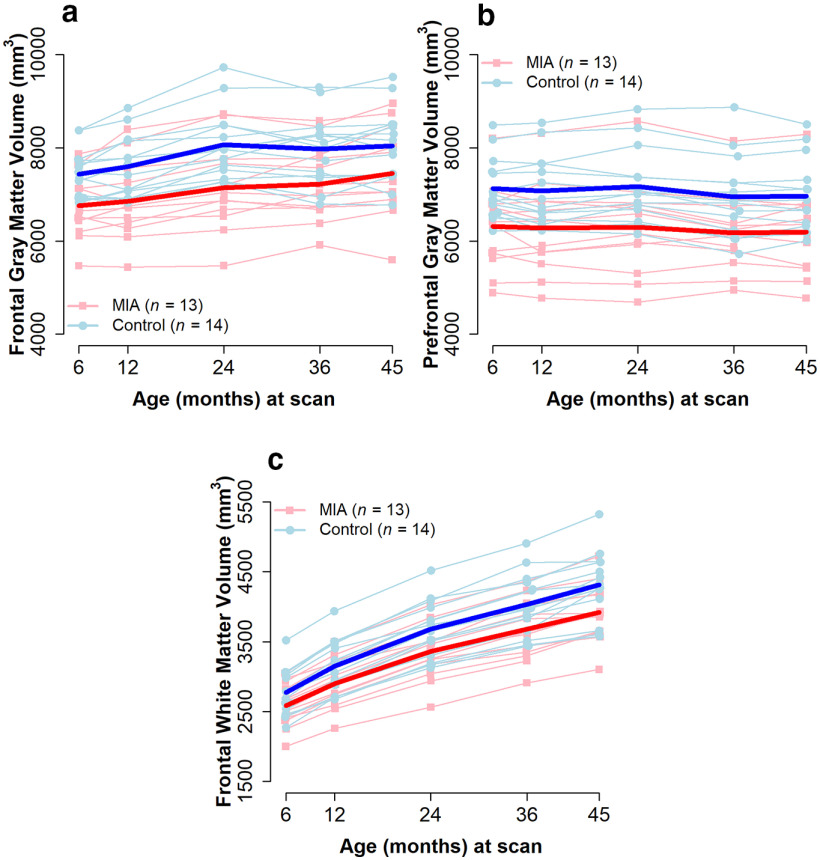
Figure 11.
Brain volume trajectories for MIA-exposed and Control offspring for (a) GM frontal and (b) prefrontal regions, and (c) WM frontal region. Light lines indicate individual trajectories. Dark lines indicate average values for the two groups. GM group differences were significant in frontal and prefrontal regions, with lower volumes in MIA across all time points. For WM, group × time interaction was significant in the frontal region, with significantly smaller volume increases from the initial 6 month measurement to the 24, 36, and 45 month measurements in MIA relative to Control.

