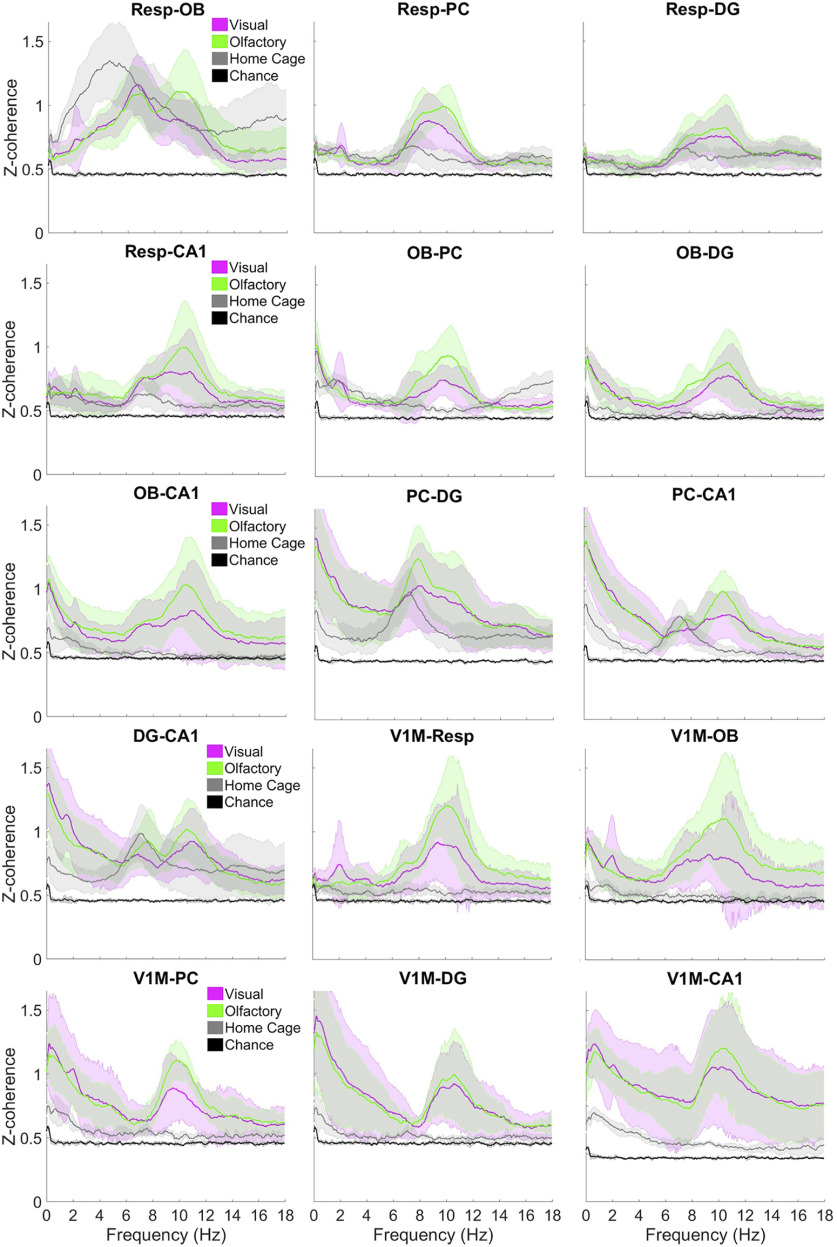
Figure 4.
Coherence across the three behavioral conditions compared with chance levels. The z-coherence is averaged across all sessions for each condition by rat with 95% bootstrap confidence intervals permuted 1,000 times across rats for all pairs. V1M was recorded in fewer rats (n = 4), whereas the rest of the pairs were recorded in all rats (n = 6). Bottom, Note difference in scale of y-axis for V1M-CA1 (right).

