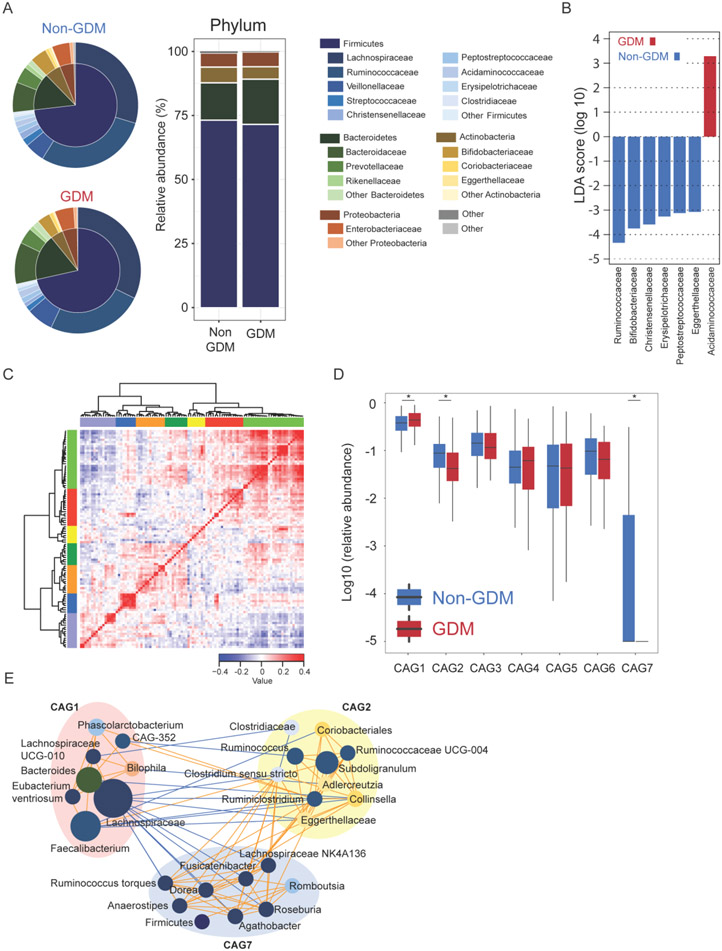
Fig. 2. Gut microbiota structure was dramatically altered before GDM diagnosis.
(A) Mean relative abundance of the most abundant phyla and families in the cohort population gut microbiome. (B) LEfSE analysis to find gut microbiome biomarkers between groups at the family level. (C) Heatmap showing Kendall correlations between top 100 most abundant genera clustered by the Spearman correlation coefficient and hierarchical Ward clustering. (D) CAGs abundance between Non-GDM and GDM groups by Mann-Whitney U test. (E) Genera level network diagram showing the enrichments of the genera in the different groups based on significantly changed CAGs. Node size indicates the mean relative abundance of each genus. Lines indicate significant Spearman association between nodes with FDR corrected P-value less than 0.01. Orange indicates positive association and blue indicates negative association. * indicates P-value <0.05.

