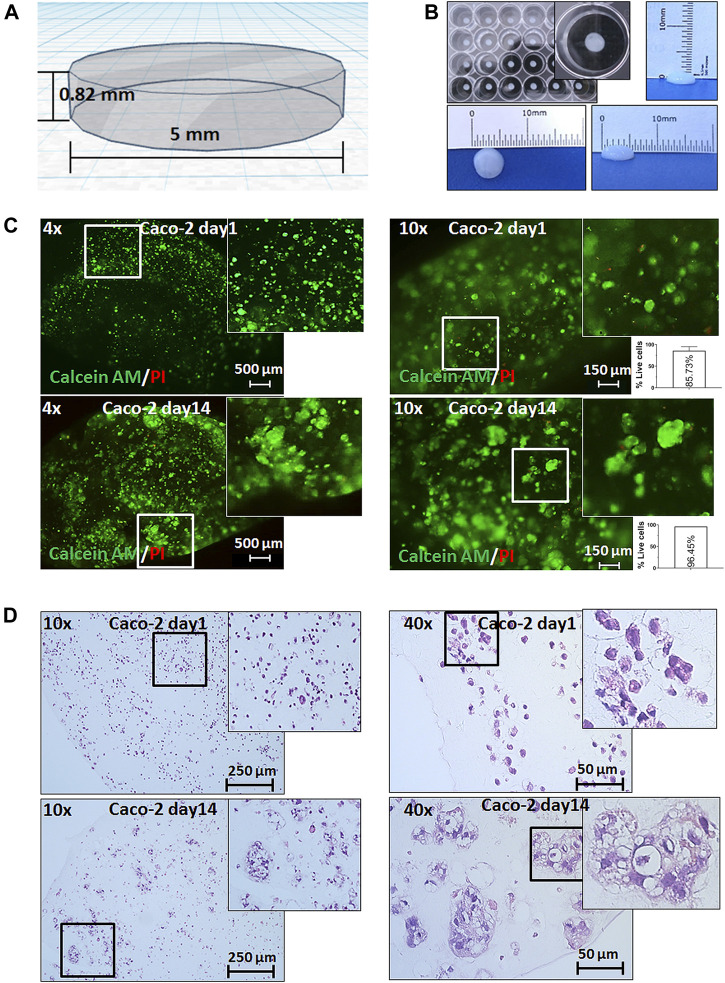
FIGURE 1.
3D bioprinting of Caco-2 cells. (A) Computer-aided design (CAD) of the developed 3D bioprinting model. (B) Representative macroscopic image of 3D bioprinted cells in a 24-well plate showing the reproducibility and uniformity of prints (with the growth medium) and of the size of a 3D bioprint. (C) Live/dead staining with calcein AM (green fluorescence) for live cells and propidium iodide (PI-red fluorescence) for dead cells on day 1 and day 14 after printing under magnifications as shown, and relative quantification of percentage live cells (per 1 mm2). Error bars represent SD of the mean from at least two images. (D) Hematoxylin and eosin (H&E) staining of 3D bioprinted Caco-2 cells on day 1 and day 14 with magnifications as annotated showing the formation of tumor-like morphological structures of cells at day 14.

