FIGURE 2.
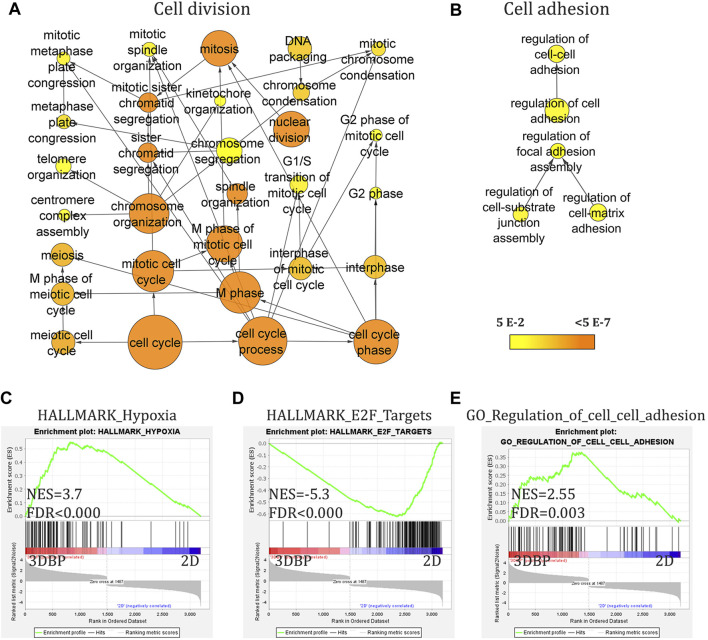
RNA-seq analysis of 3D bioprinted and 2D monolayer Caco-2 cells. (A) and (B) Gene ontology (GO) analysis (with BinGO in Cytoscape, cutoff 1.5-fold change and adj. p-value<0.05) of all differentially expressed genes showing nodes involved in cell cycle regulation and of upregulated genes in 3D bioprinted (3DBP) cells showing nodes for cell adhesion. (C–E) Gene set enrichment analysis (GSEA) of differentially expressed genes (cutoff 1.5-fold change and adj. p-value<0.05) demonstrating enrichment for genes involved in hypoxia and cell–cell adhesion. ((C) and (E)) Negative enrichment (downregulation) of genes involved in cell cycle progression/control.

