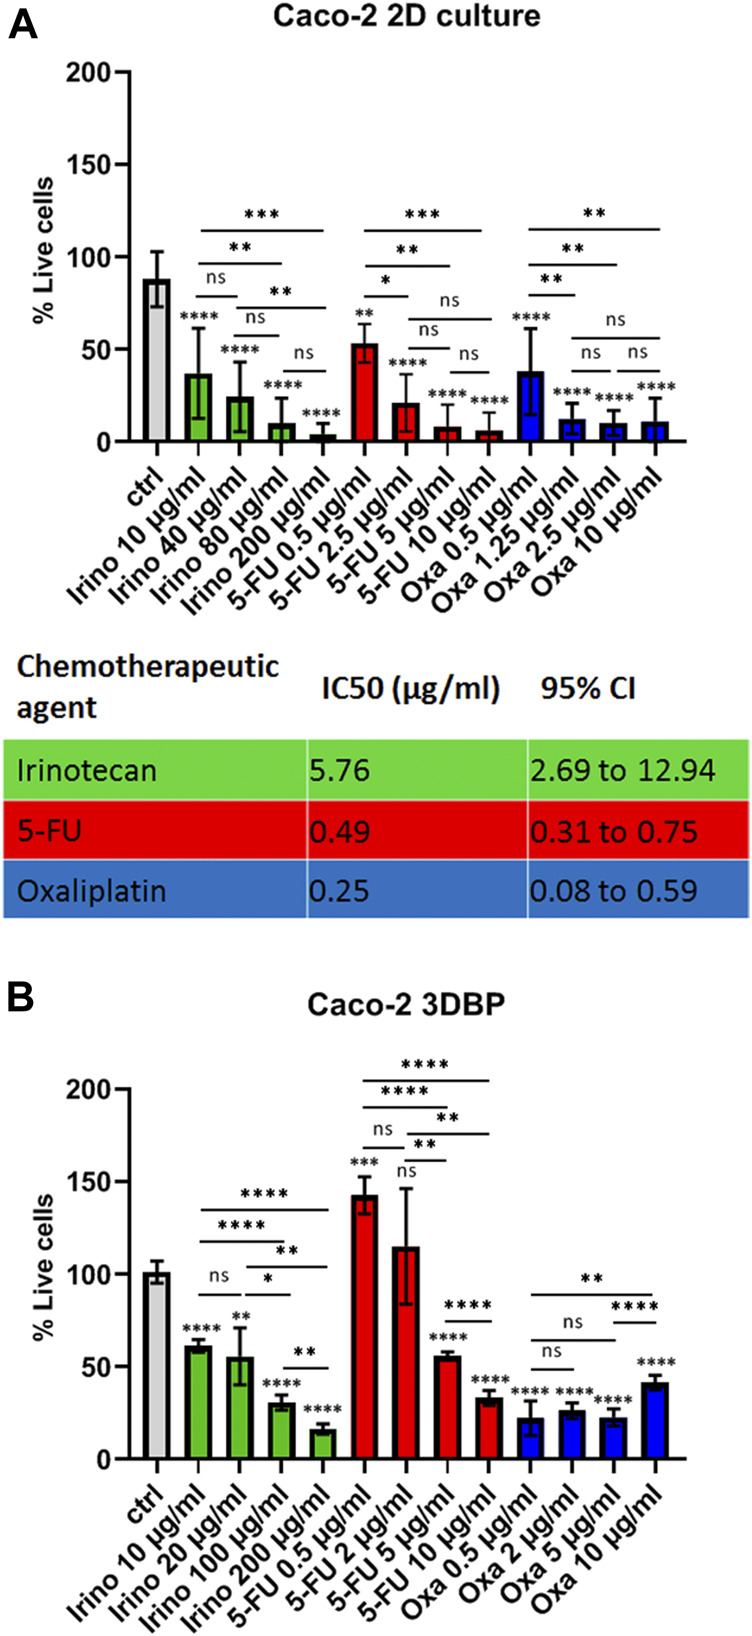
FIGURE 3.

Drug response in 2D cells vs 3D bioprinted cells. (A) Response of Caco-2 cells grown in monolayers (2D) to different concentrations of irinotecan, 5-fluoruracil (5-FU), and oxaliplatin as annotated and a summary table of the respective IC50 values. Cells were seeded and treated on the next day with the inhibitors for 72 h. Cell viability was measured with the MTT test, and IC50 values were calculated from at least 2 biological replicates in technical triplicates. IC50 values and 95% confidence interval values are both in ug/ml. (B) Response of 3D bioprinted cells (biological duplicates in technical duplicates) to 4 concentrations of the 3 inhibitors as annotated. Caco-2 cells were bioprinted (as described in Methods) and grown for 2 weeks prior to drug treatment. Error bars represent mean with SD. *p ≤ 0.05, **p ≤ 0.005, ***p < 0.0005, and ****p < 0.0001, ns: not significant, Student’s t-test. Asterisk symbols immediately above error bars indicate significance compared to control samples; lines with symbols show significance between the relevant treatment groups.
