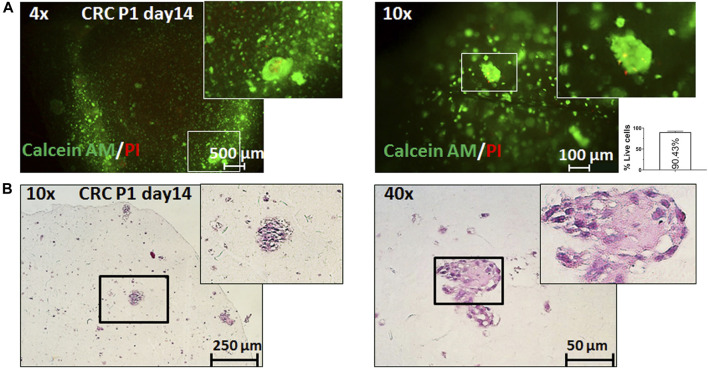
FIGURE 4.
3D bioprinting of primary CRC samples. Representative pictures of 3D bioprinted primary CRC cells taken on day 14 after printing. (A) Live/dead staining with calcein AM (live cells: green fluorescence) and propidium iodide (dead cells: red fluorescence) under ×4 and ×10 magnification and relative quantification of percentage live cells (per 1 mm2). Error bars represent SD of the mean from at least two images. (B) Representative pictures of the hematoxylin and eosin (H&E) staining of sections from 3D bioprinted primary cells under ×4 and ×10 magnification.

