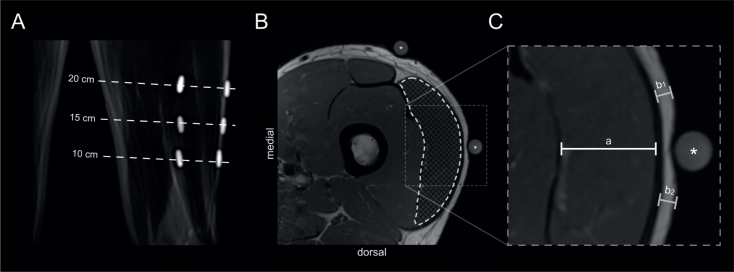
Fig. 3.
Representative images of magnetic resonance imaging (MRI) measurements. (A) A coronal survey scan shows the left leg as an example. Two fish-oil capsules per height were taped onto each thigh to allow for a more precise planning of axial T1-weighted imaging. (B) Measurement of the vastus lateralis muscle cross-sectional area (white dashed line) was performed on an axial slice of interest, in which both fish-oil capsules (asterisk) could be depicted. (C) Inset showing how muscle thickness (MT) (a) and subcutaneous adipose tissue thickness (SAT) are measured. Since the capsule itself led to a slight indentation in the subcutaneous adipose tissue, the thickness of the unaffected neighbouring regions (b1+b2) were measured instead and then averaged to avoid measurement error.

