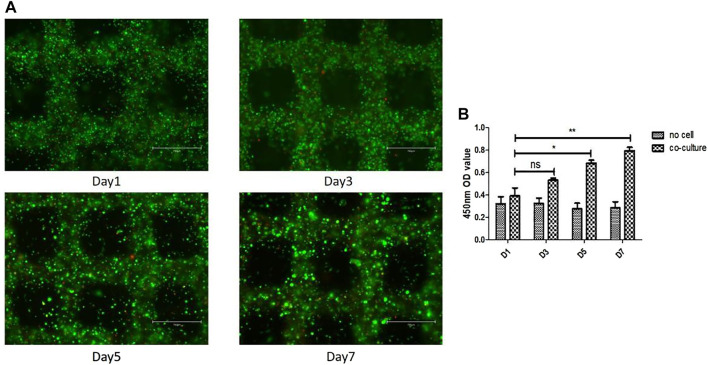
FIGURE 3.
Cell survival and proliferation in the 3D cell laden pannus tissue model. (A) Cell survival at different time points after printing. Live and dead cells were labelled with calcein-AM (green) and PI (red), respectively. Scale bar, 750 μm. (B) Proliferation rates of cells in 3D co-culture cell laden scaffolds at day 1, 3, 5, and 7.

