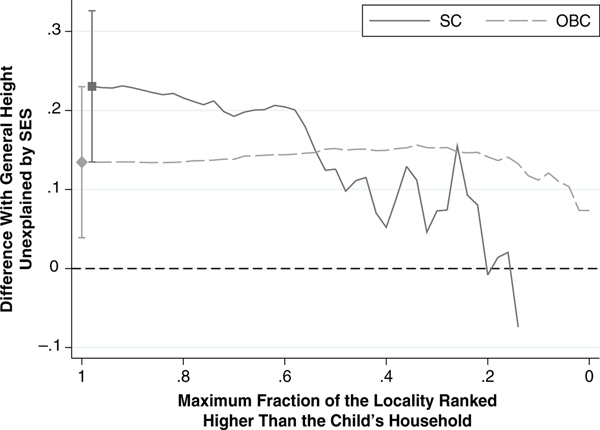
Fig. 4.
Decomposition results. SES explains more of the SC and OBC height gaps for children who are less locally outranked. The figure uses NFHS-3 data on rural India to estimate height gaps between general caste and OBC children, and general caste and SC children, computed using many replications of the reweighting decomposition described in the Data and Empirical Strategy section. The horizontal axis indicates which OBC or SC children are used in the reweighting decomposition. For example, at 0.4, an OBC or SC child is included if she lives in a locality in which 40 % or fewer of households in the PSU outrank her household by caste. The figure proceeds horizontally in intervals of 0.02 and connects points with no smoothing. See the Empirical Strategy section and the Reweighting Decomposition Results section for further details.

