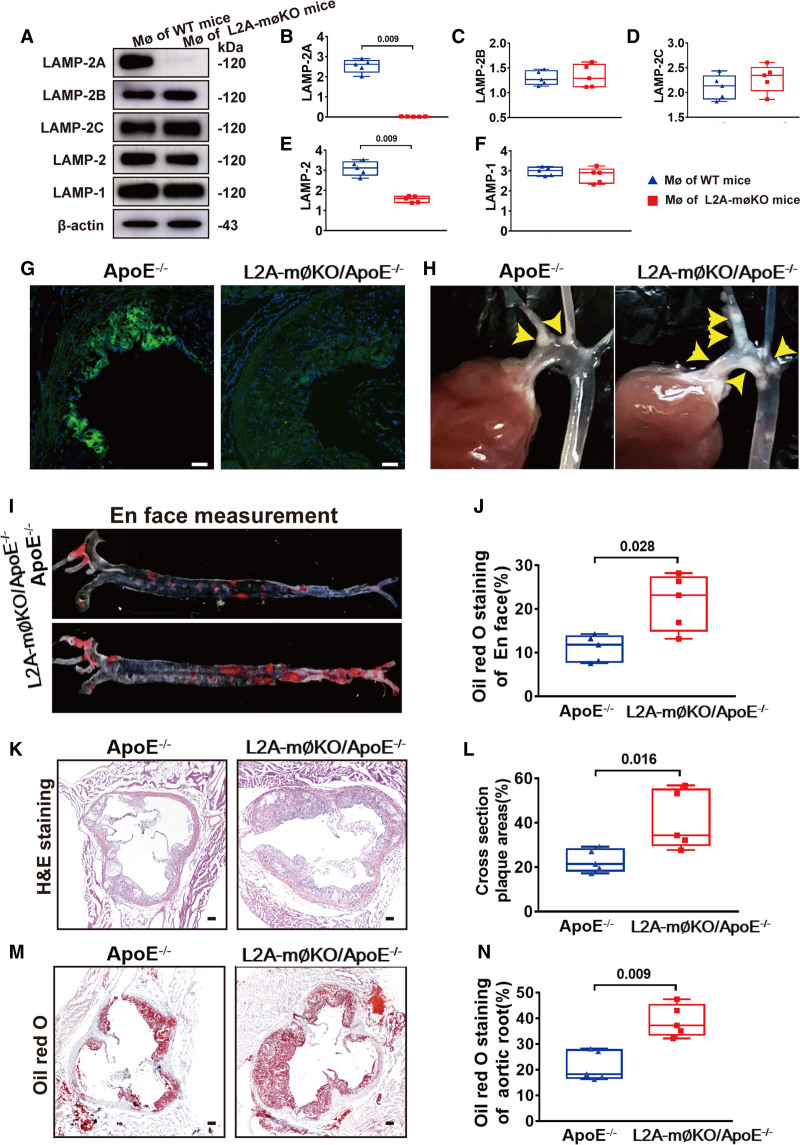
Figure 3.
Quantification of aortic atherosclerotic lesions in control and L2A-mØKO mice (macrophage (MØ)-specific LAMP-2A (lysosome associated membrane protein type 2A; L2A)-knockout mice). A, Representative western blot analysis to determine the efficiency of LAMP-2A knockout in primary peritoneal MØs from wild-type (WT, C57 background, male) and MØ-specific L2A-knockout (L2A-mØKO, C57 background, male) mice. n=5 in each group. B–F, Quantification of protein expression of LAMP-2A, LAMP-2B, LAMP-2C LAMP-2, and LAMP-1 in control WT mice (male) and L2A-mØKO mice (male). Five independent experiments were performed. Data were presented as medians and quartiles. Statistical analysis of B–F was conducted using Mann-Whitney test. G, Representative immunofluorescence analysis to detect LAMP-2A (green particles) in frozen aortic root sections from control ApoE−/− mice and L2A-mØKO/ApoE−/− mice (male). Bar=100 μm. H, Representative photographic images of atherosclerotic plaques (yellow arrows) in the aortic arch and their branches from ApoE−/− mice and L2A-mØKO/ApoE−/− mice (male). I–J, Representative Oil-red-O staining and en face analysis of atherosclerotic lesions in the whole aorta (n=5 in each group). Data were presented as medians and quartiles. Statistical analysis was performed using Mann-Whitney test. K and L, Hematoxylin and eosin (HE) staining and cross-sectional analysis of atherosclerotic lesions in the aortic root (n=5 per group). Data were presented as medians and quartiles. Statistical analysis was conducted using Mann-Whitney test. Scale bar=100 μm. M and N, Oil-red-O staining and cross-sectional analysis of atherosclerotic lesions in the aortic root (n=5 per group). Data were presented as medians and quartiles. Statistical analysis was performed using Mann-Whitney test. Scale bar=100 μm.

