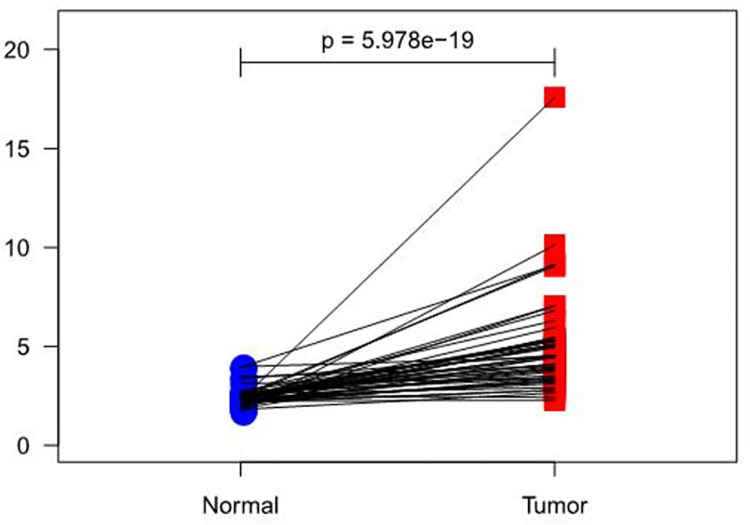
Fig 7. A paired scatter plot of RIOX2 gene differential expression between cancerous tissue and adjacent normal tissue in lung squamous cell carcinoma.
The abscissa represents the sample group and the ordinate represents the RIOX2 gene expression level. The red represents the cancer tissue sample group and the blue represents the normal sample group.

