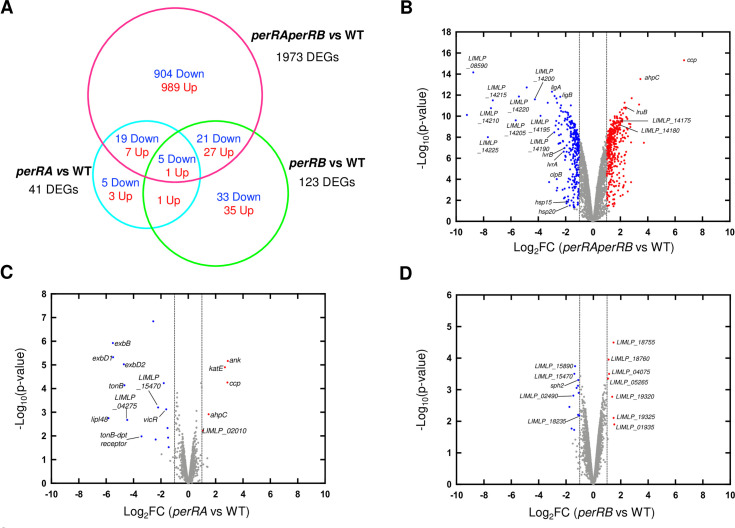
Fig 8. Differential gene expression in the perRAperRB mutant.
(A) Venn diagram showing the overlap of differentially-expressed ORFs (with an adjusted p-value < 0.05) in the double perRAperRB mutant (in pink) with those of the perRA mutant (as determined by Zavala-Alvarado et al. [19]) (in cyan) and of the perRB mutant (as determined in this study) (in green). (B)-(D) Volcano scatter representation of differentially-expressed genes in the perRAperRB mutant (B), in the single perRA mutant (as determined by Zavala-Alvarado et al. [19]) (C), and in the single perRB mutant (as determined in this study) (D). Red and blue dots indicate significantly up- and down-regulated genes, respectively, with a Log2FC cutoff of ±1 (dashed vertical lines) and p-value<0.05. Selected genes are labelled.

