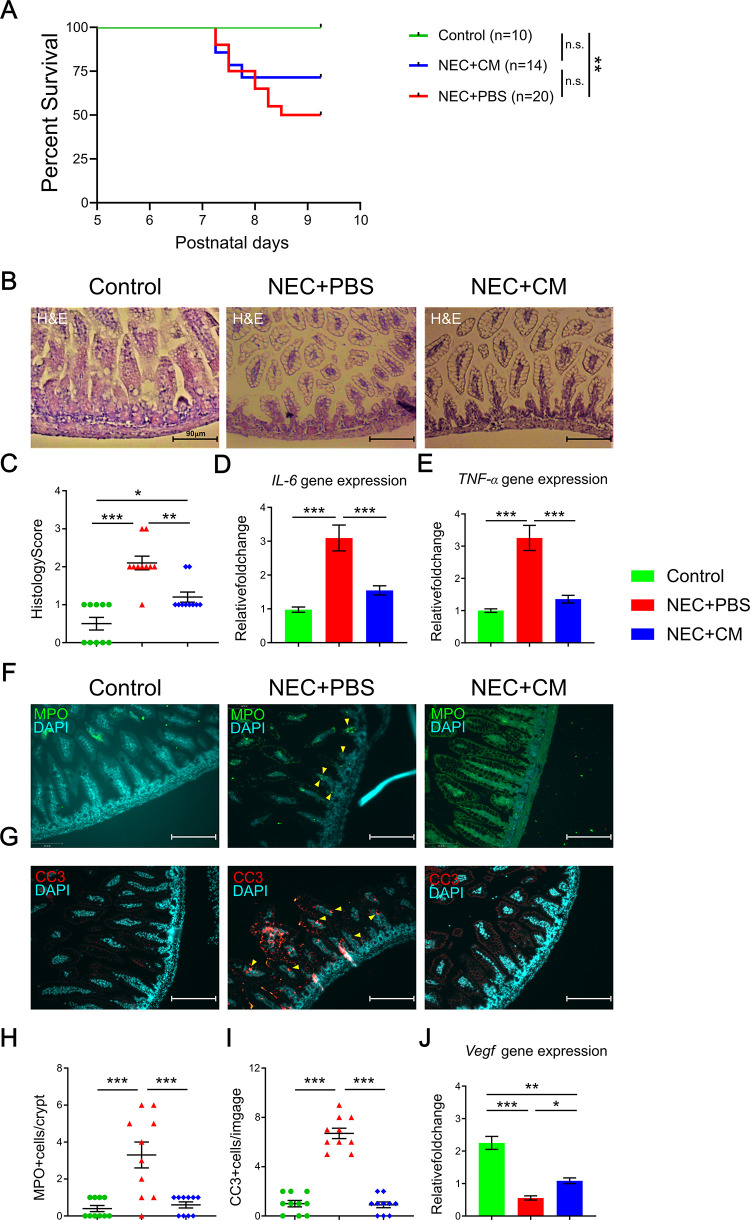
Fig 2. NEC survival and intestinal injury.
(A) Survival curves for mice pups from the 3 groups on postnatal days 5 to 9. (B) Representative histological images of the terminal ileum. (C) Histological score of intestinal injury. Inflammatory gene marker expression of (D) Il-6 and (E) Tnf-α. Immunofluorescent protein expression of (F) MPO and (G) CC3 in the terminal ilea of the 3 groups. Yellow arrows indicate positive staining. Relative quantification of the (H) MPO and (I) CC3 protein expressions. (J) Angiogenesis/vascularization Vegf gene expression in the 3 groups. Data are presented as mean ± standard error, with significance of group comparisons based on one-way ANOVA and Tukey post-hoc tests. n = 10 for each group, *p<0.05, **p<0.01, and ***p<0.001.

