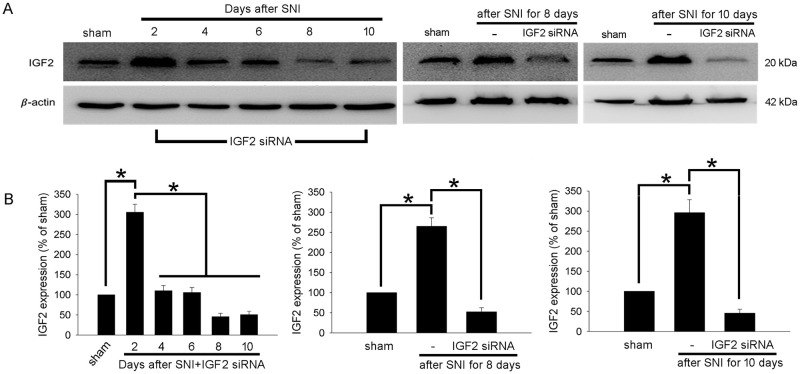
Fig 4. Intrathecal injection of IGF2 siRNA decreases IGF2 protein expression in the spinal cord.
Western blotting analysis for IGF2 in protein extracts from spinal cord tissue in different groups and timepoints. (A) Left, comparison of IGF2 protein expression levels in the spinal cord dorsal horn in the sham group and in the SNI + IGF2 siRNA group (on Days 2, 4, 6, 8, and 10). Middle, comparison of IGF2 protein expression levels in the spinal cord dorsal horn in the sham group, SNI group and the SNI + IGF2 siRNA group (after SNI for 8 days). Right, comparison of IGF2 protein expression levels in the spinal cord dorsal horn in the sham group, SNI group and the SNI + IGF2 siRNA group (after SNI for 10 days). Representative blots are shown. (B) Quantitative analysis of IGF2 expression shown in (A). The IGF2/β-actin ratio in the sham group is set to 100%. Data are presented as mean ± standard deviation (n = 3); *P < 0.05 corresponds to significant difference. siRNA, small-interfering RNA; IGF2, insulin-like growth factor-2.

