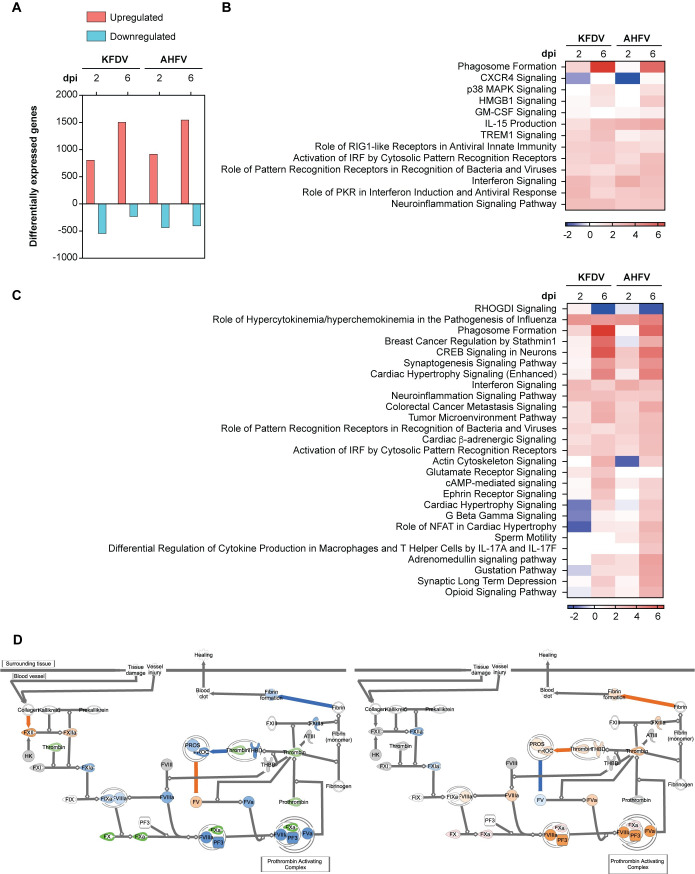
Fig 7. Transcriptional dynamics in blood of PTMs inoculated with KFDV and AHFV.
Whole blood from PTMs inoculated sc/iv with KFDV or AHFV was subject to RNAseq at 0, 2, and 6 dpi. A. Differentially expressed genes (DEG) at 2 and 6 dpi with fold change > |1.5| relative 0 dpi and P < 0.05. B. Heat map of z-scores depicting changes in cellular immune response pathways following inoculation with KFDV or AHFV. C. Heat map of z-scores showing significantly enriched and differentially activated pathways between KFDV and AHFV- inoculated PTMs. D. Predicted function of the intrinsic prothrombin activation pathway at 2 dpi using IPA following inoculation with KFDV (left) and AHFV (right). (Predicted activation (orange), predicted inhibition (blue), observed downregulation (green).

