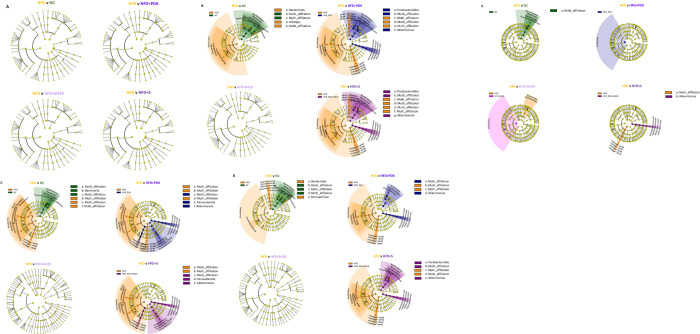
Fig 2. Cladogram shown for LEfSe analysis performed on the complete sequence data.
The significant LDA scores for the bacterial taxon found by LEfSe were ranked according to their effect size and associated by color with each treatment. (A) Fecal samples at week 0. (B) Fecal samples at week 8. (C) Ileum samples. (D) Colon samples. (E) Adipose tissue (MAT) samples.

