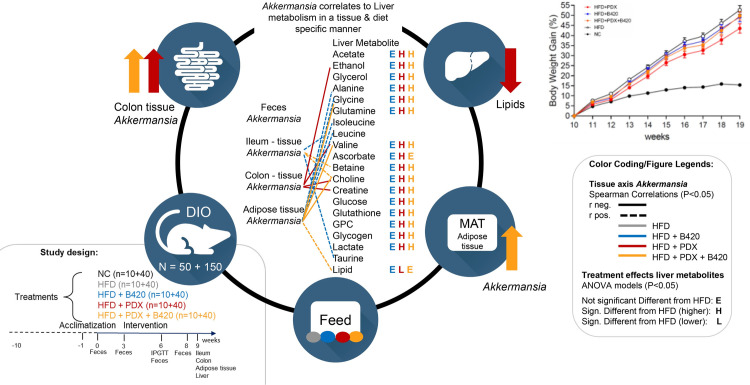
Fig 5. Graphical abstract of findings including overview of the Akkermansia abundance in different tissues with Spearman rank correlations to liver metabolites (color coded to treatment).
The treatment effect of each liver metabolite is given relative to HFD (legends E, H, L) based on the ANOVA model in Table 2.

