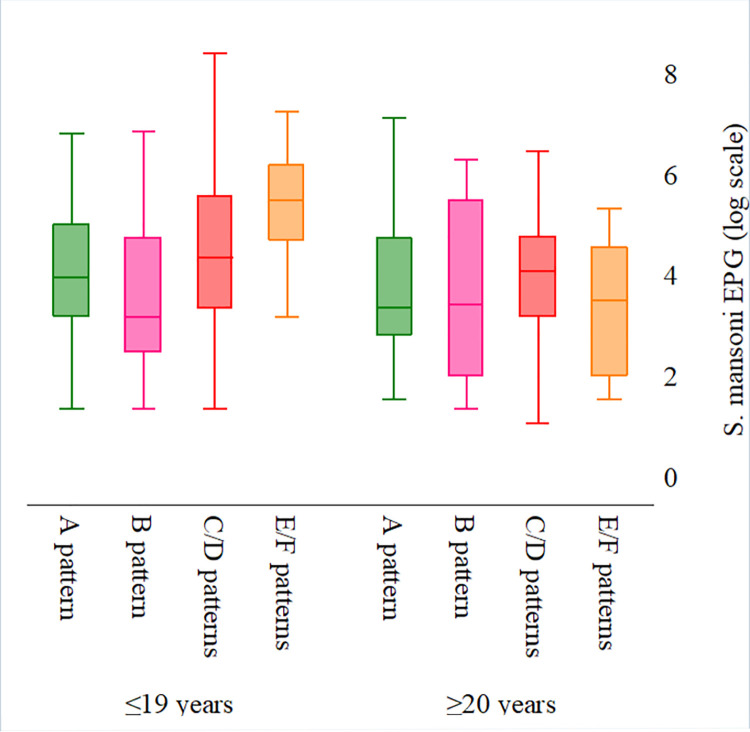
Fig 7. S. mansoni infection intensity by liver parenchyma patterns and age in the 2017 Ituri morbidity study (n = 586).
A (dark green) and B (purple) patterns: normal; C (maroon) and D (cranberry) patterns: mild PPF; E (red) and F (orange) patterns: severe PPF; Fatty liver (pink) [22].

