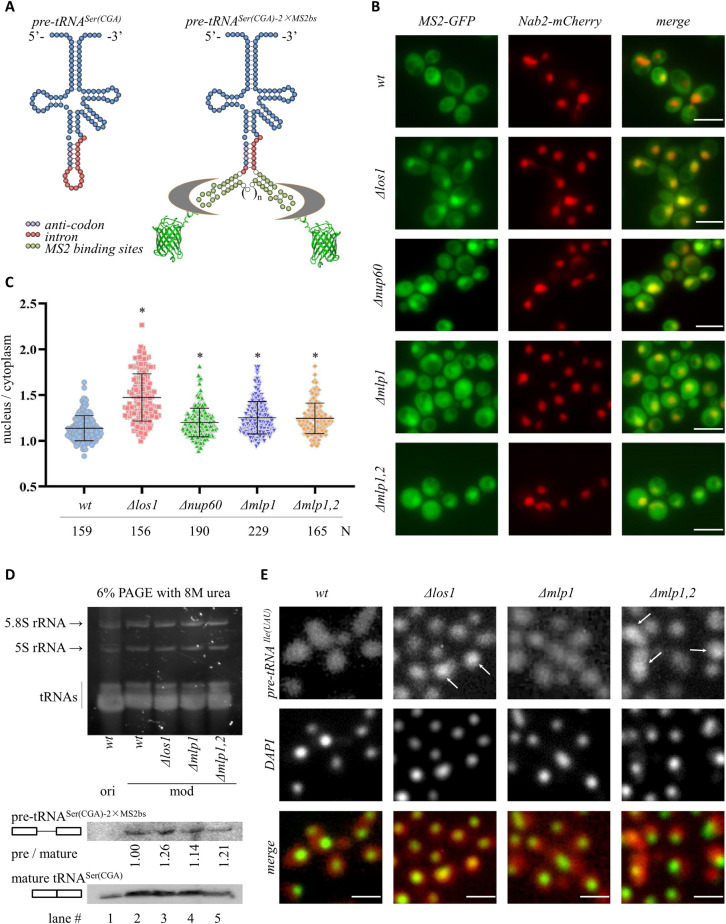
Fig 2. Mlp1/2 are required for tRNA export.
(A) Schematics of unprocessed pre-tRNASer(CGA) with and without synthetic MS2 sites. Color code of nucleotides is shown. The MS2 sites are bound by an MS2-GFP chimera that is expressed in yeast. The intron containing MS2 sites is spliced from the tRNA when it reaches the mitochondrial surface in the cytoplasm. (B) Representative images of cells expressing pre-tRNASer(CGA) with MS2 sites, MS2-GFP, as well as Nab2-mCherry to image the nucleus. Asynchronously grown cultures of strains MRG5788 (wt), MRG5789 (Δlos1), MRG5787 (Δnup60), MRG5816 (Δmlp1), and MRG5817 (Δmlp1,2) were used. Scale bar = 10 μm. (C) Quantification was done by calculating the ratio of nuclear / cytoplasmic GFP signal intensity and shown in the column scatter graph. N denotes the number of cells examined, and *P < 0.05 by Student’s t-test when compared with the wt strain. (D) Nucleic acid staining (top) and Northern analysis (bottom) of RNAs isolated from yeast cells carrying the original wildtype tS(CGA)C [ori, strain MRG7400 (wt)] or the modified tS(CGA)C-2×MS2bs [mod, strains MRG5788 (wt), MRG5789 (Δlos1), MRG5816 (Δmlp1) and MRG5817 (Δmlp1,2)] gene. A single 3’-DIG labeled LNA-modified oligonucleotide probe was used to detect both pre-tRNASer(CGA)-2×MS2bs (pre, 5-minute exposure) and mature tRNASer(CGA) (mature, 20-second exposure). The ratio of pre / mature is indicated below each lane. A single 2-minute exposure of the whole blot is shown in S1B Fig. (E) FISH analysis for pre-tRNAIle(UAU) (red in the merged image) in strains BY4741 (wt), MC343 (Δlos1), MC344 (Δmlp1) and MC345 (Δmlp1,2). DAPI staining (green in the merged image) of DNA shows the nuclei. Scale bar = 10 μm.

