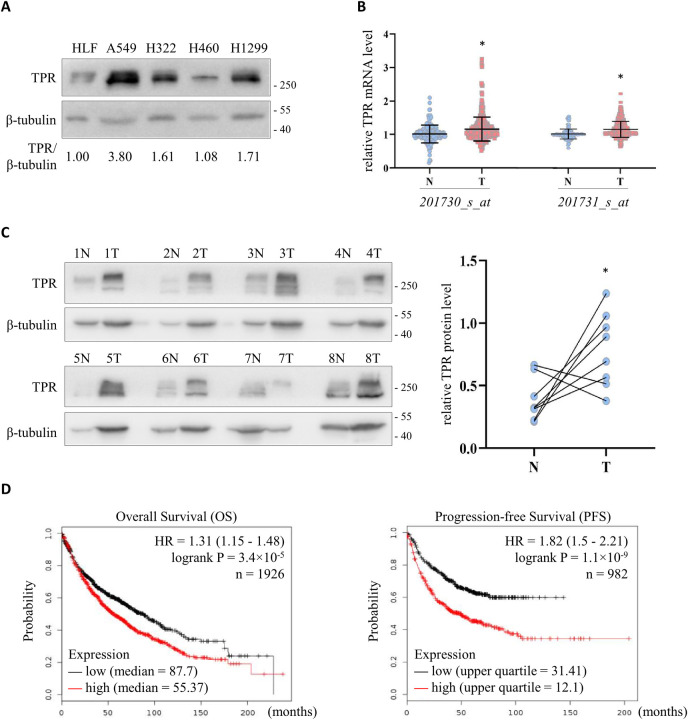
Fig 3. Elevated expression of TPR in lung cancer cell lines and tissues.
(A) Western blot to detect the expression of TPR in lung cancer cell lines. HLF (human lung fibroblast) served as the normal control, while A549 (lung adenocarcinoma cell), H322 (bronchioalveolar carcinoma cell), H460 (large cell lung cancer cell) and H1299 (lung carcinoma cell) were representative lung cancer cells. β-tubulin was used as the loading control. (B) TPR mRNA level in human lung cancer (T, n = 356) and non-tumor (N, n = 161) tissues. Data were extracted from GSE7670, GSE10072, GSE19188 and GSE31210, normalized to the median value of the non-tumor tissues in each dataset, and compiled for analysis. *P < 0.05 by Student’s t-test. (C) Left: Western blot to detect the expression of TPR in paired tumor (T) and adjacent non-tumor (N) tissues from lung cancer patients. β-tubulin served as the loading control. Right: Quantification of TPR expression relative to β-tubulin in patient samples. *P < 0.05 by Student’s t-test for pairwise comparison. (D) The prognostic value of TPR mRNA level in lung cancer patients from KM plotter. Overall survival (OS, left) and progression-free survival (PFS, right) curves were plotted using 201731_s_at, which was selected as the optimal microarray probe to represent TPR by JetSet. The low and high TPR expression patient cohorts were compared by a Kaplan-Meier survival analysis, and the hazard ratio (HR) with 95% confidence intervals and logrank P value were calculated.

