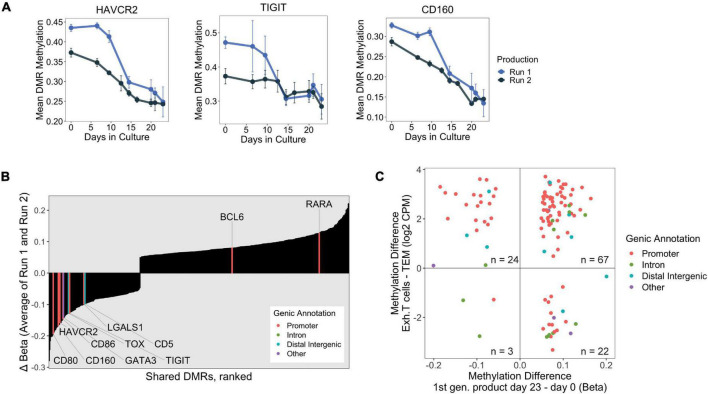
FIGURE 4.
(A) DNA methylation changes over 23 days at the promoters of select exhaustion-associated loci. (B) Consistently “Late” shared DMRs were ranked by final change in methylation (Day 23 – Day 0, averaged over both production runs). Genes implicated in exhaustion, taken from publicly available datasets, are highlighted with associated genic annotation. Notably, many of the exhaustion associated genes are among the strongest hypomethylated DMRs. (C) Scatter plot displaying shared DMRs which overlapped with ExhDMRs identified from WGBS comparing exhausted CD8 T cells vs. CD8 effector memory T cells. The x-axis depicts methylation difference between day 23 and day 0 products (average of both runs), and y-axis depicts methylation difference between functionally exhausted CD8 T cells (Exh. T cells) and CD8 effector memory T cells (TEM).

