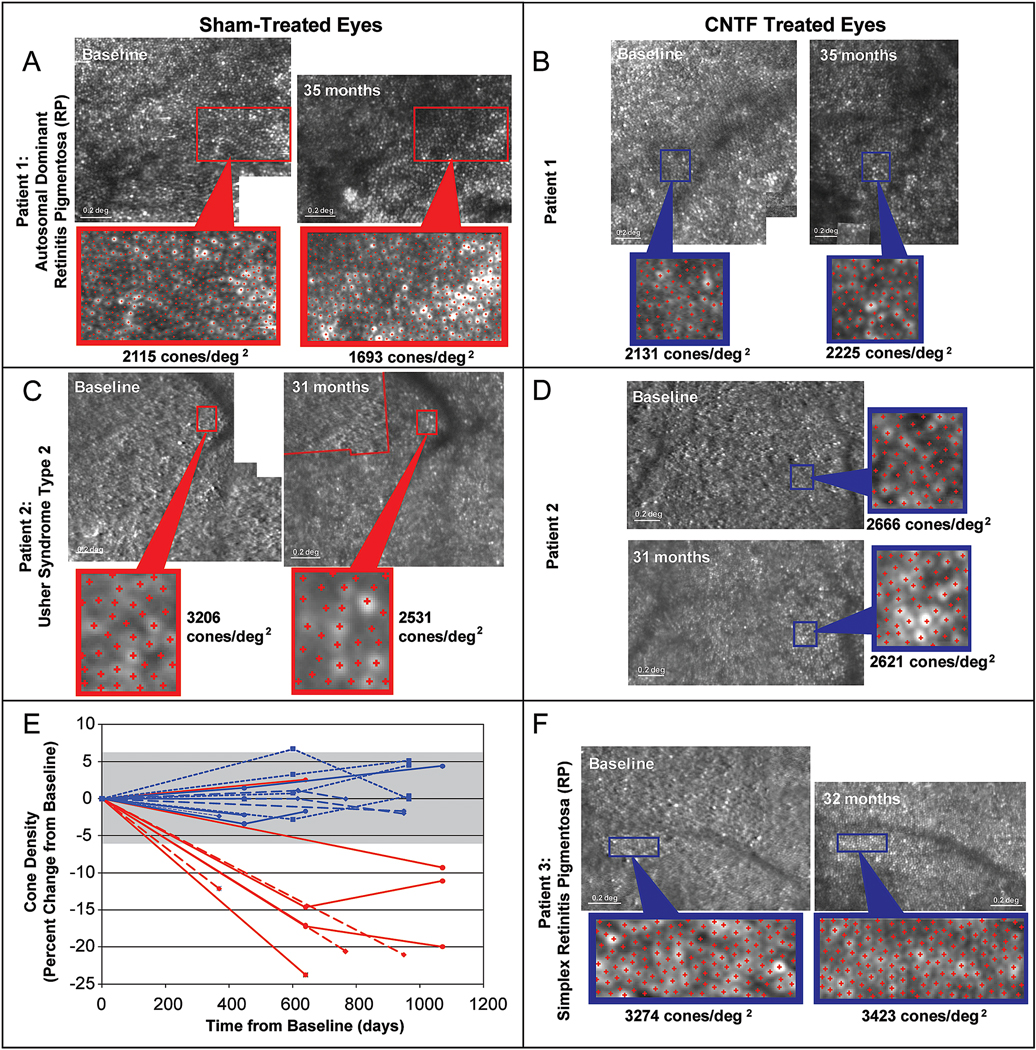
Fig. 11.

AOSLO images show changes in cone spacing over time in eyes with rod-cone degeneration. Images from 3 patients who received sham surgery (A and C, red outlines) in one eye and sustained-release ciliary neurotrophic factor (CNTF) (B, D and F, blue outlines) were imaged at baseline and 31–35 months later. Rectangles outline regions of interest where cone density was measured. E) Cone density decreased over time in all but 1 sham-treated region (red lines, n = 9), while all regions in the CNTF-treated eyes (n=12) remained within the measurement error (± 6.3%, gray shaded bar). Reproduced from Talcott et al. (2011), copyright by the Association for Research in Vision and Ophthalmology.
