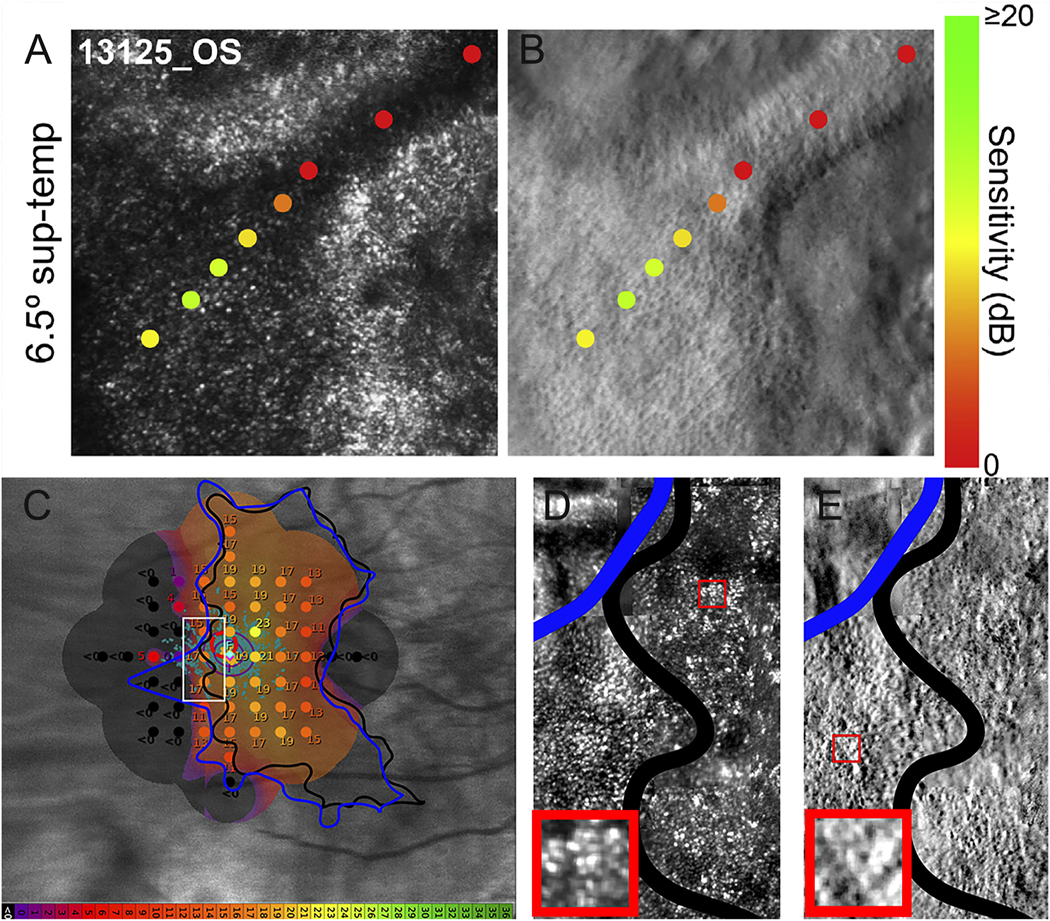
Fig. 13.

AOSLO imaging and microperimetry demonstrates cone structure and function in eyes with choroideremia. AOMP demonstrates sensitivity near the margin of atrophy (yellow and orange spots), with dense scotomas (red spots) corresponding to outer retinal tubulations in confocal (A) or split detector (B) AOSLO images. C) Fundus-guided microperimetry shows retinal sensitivity in decibels ranging from good (yellow) to not seen (black) in an eye with choroideremia. The margin of retinal atrophy as determined from SW-AF images (black line) differs from the margin as defined from swept-source OCT images (blue line). Retinal sensitivity is measurable beyond the margin of retinal atrophy defined using both methods (orange spots), although the accuracy of the microperimetry stimulus delivery likely accounts for some of the difference. Other regions within the margin of retinal atrophy as defined from swept-source OCT images (blue line) show dense scotomas (black spots, <0 dB). Confocal (D) and split detection (E) AOSLO images from the region outlined with a white box in (C) show cone profiles within and beyond the black line (regions of interest outlined in red boxes; insets show cone profiles in regions of interest magnified 300%). Modified from (Foote et al., 2019b), copyright by the Association for Research in Vision and Ophthalmology and reprinted from Tuten et al. (2019) Copyright 2019, with permission from Elsevier.
