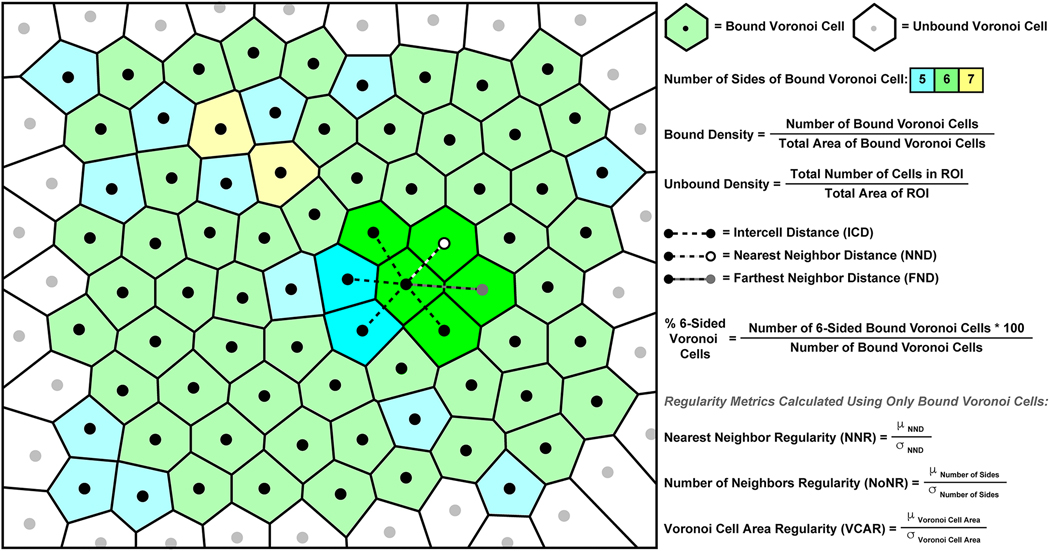
Fig. 16.
A schematic of cone mosaic illustrating the basis of some commonly used spatial cone metrics. Each cone within the rectangular region of interest (ROI) is represented by a circle, light gray circles with unfilled surrounding areas are cells with a Voronoi domain that is unbounded. In contrast, the black circles with a shaded surrounding area are cells with a bound Voronoi domain (with the color representing the number of sides of the Voronoi polygon). Bound density is estimated by taking the number of bound cells and dividing by the total area of the bound Voronoi cells. Unbound density is simply the total number of cells in the ROI divided by the area of the ROI. For each bound cell in the ROI, the mean intercell distance (ICD) to its immediate neighbors can be calculated, along with the nearest immediate neighbor and the farthest immediate neighbor (NND and FND, respectively). In a perfectly triangular mosaic, all bound Voronoi cells will have six sides (i.e, a hexagon). The percentage of bound cells with six sides can be used to assess mosaic packing geometry. Finally, regularity metrics (M) look at the mean value of a metric across all bound cells (μM) divided by the standard deviation of the metric across those same cells (σM).

