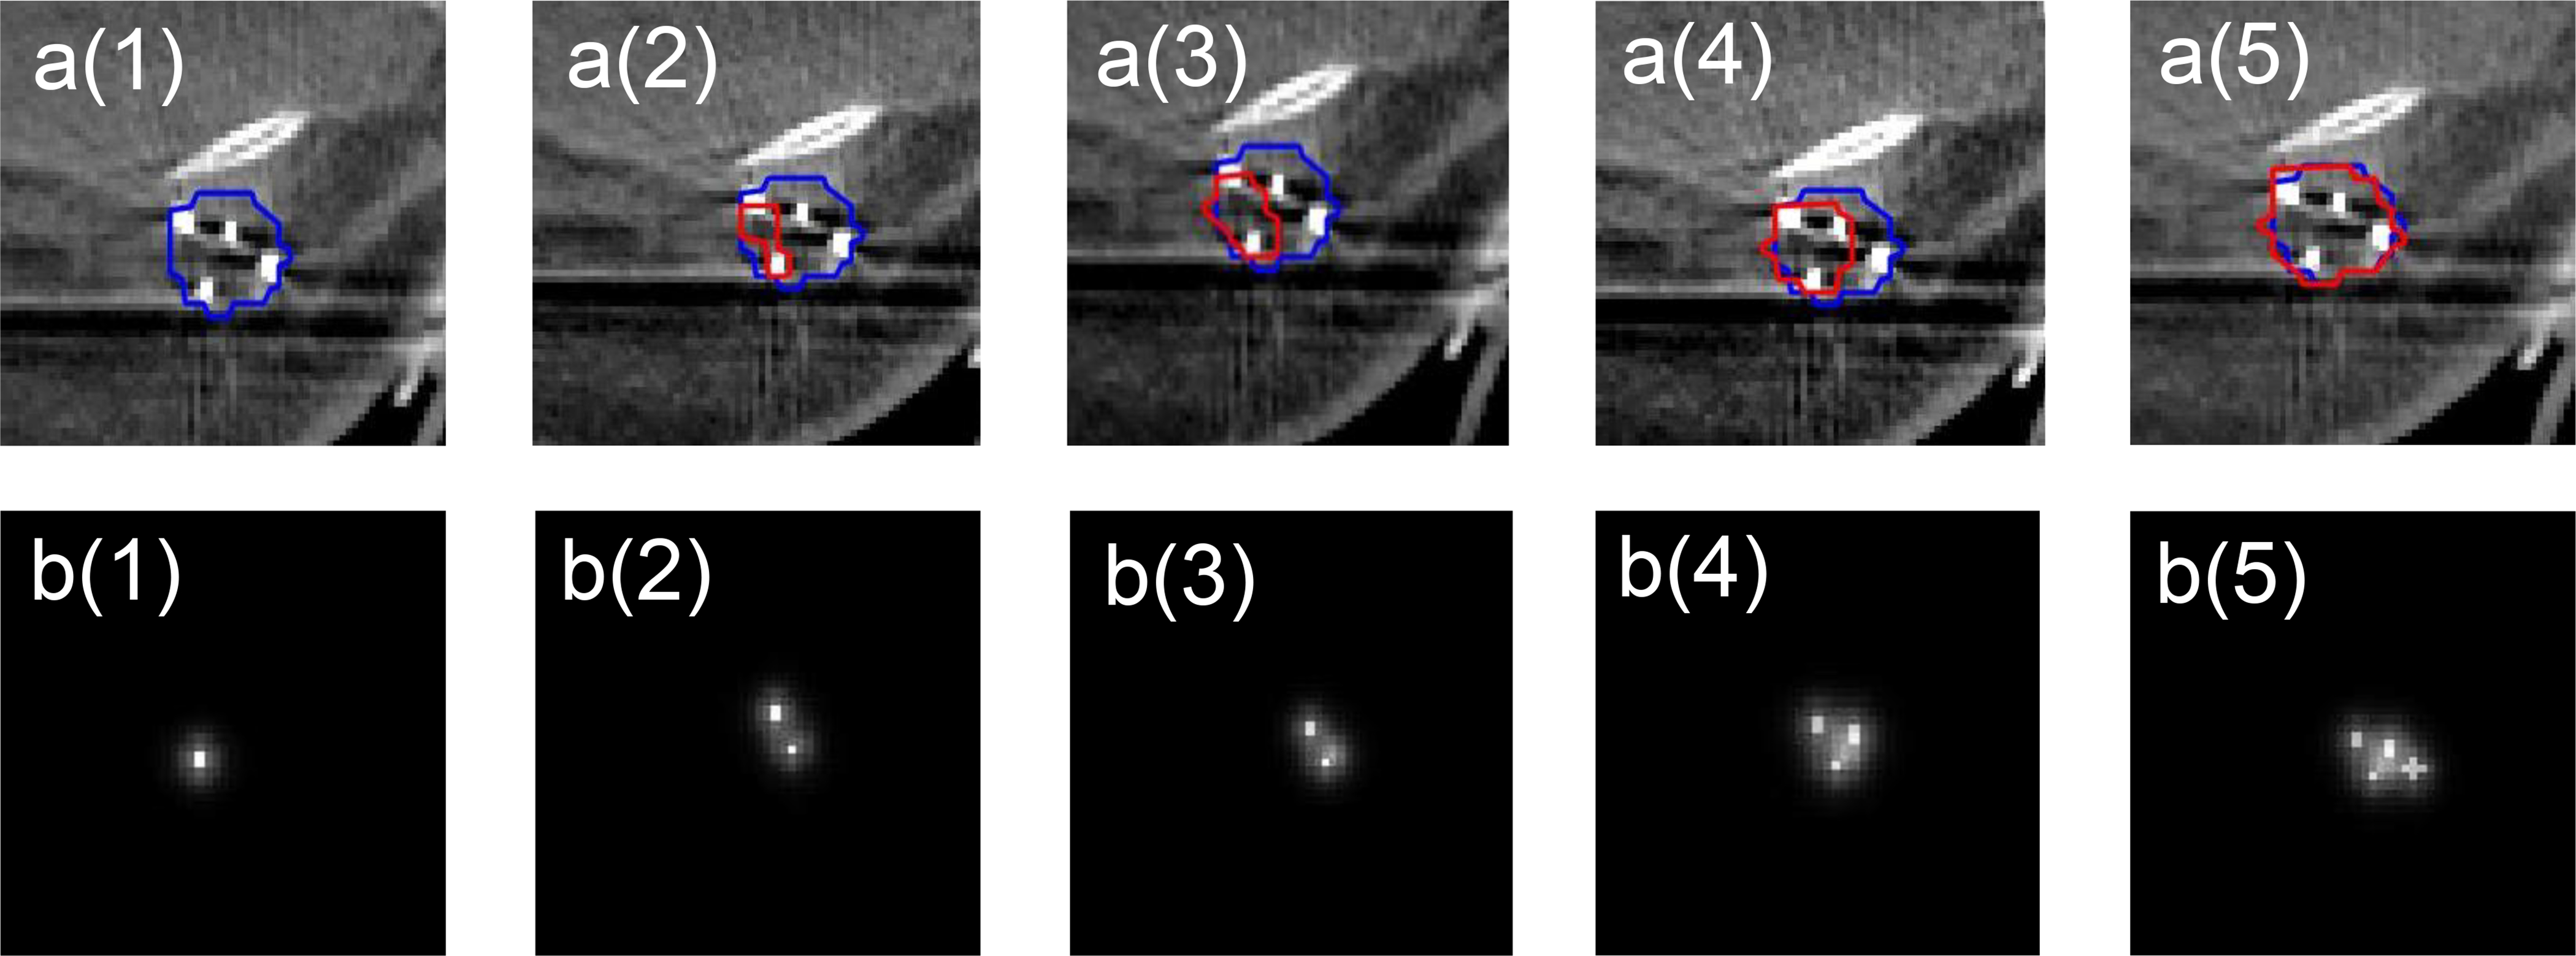
Figure 4.

The effects of saliency map’s quality on the segmentation outcomes. a(1)-a(5): Examples of CT images with TBV contour (blue) and the predicted contour by the proposed saliency-guided structure (red). b(1)-b(5): Saliency maps with varying levels of location cue information.
