Fig. 1.
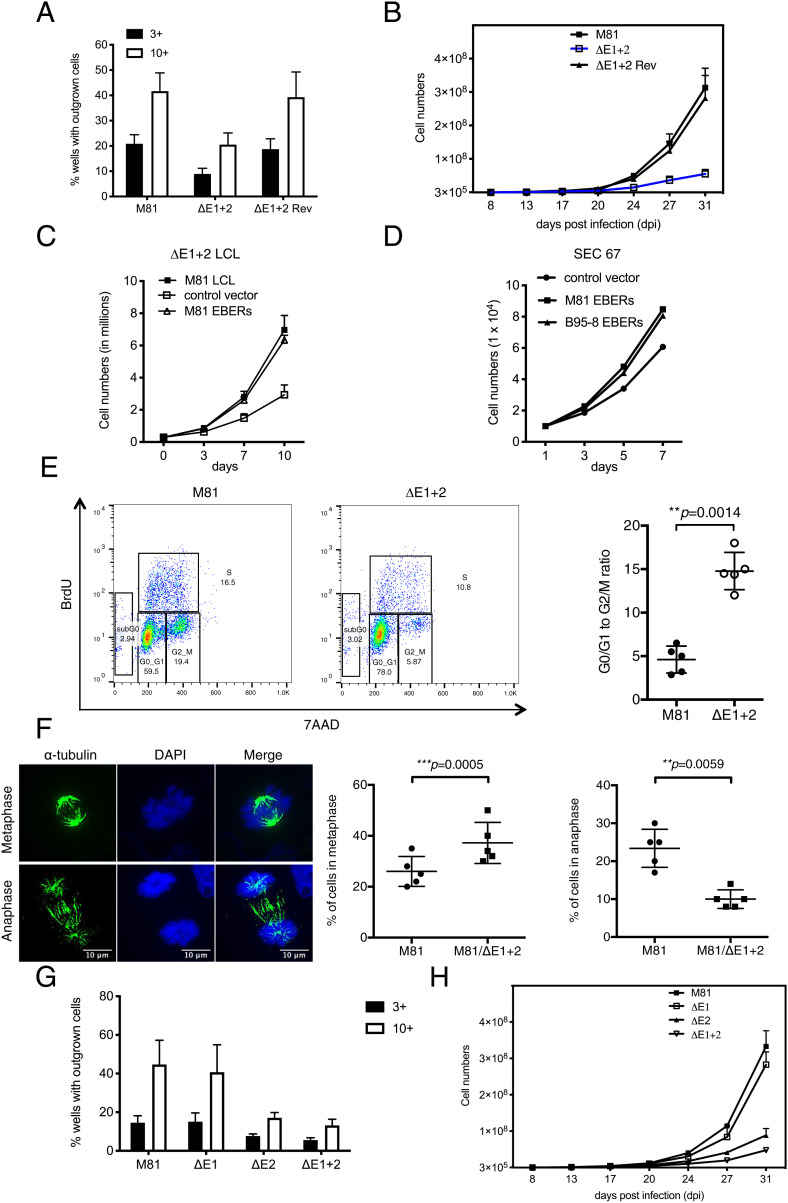
The M81 EBERs enhance cell growth. (A) We compared B cell growth after infection with M81, M81/ΔE1 + 2, and M81/ΔE1 + 2 Rev by counting the number of outgrowing wells in 96-well plates seeded with infected primary B cells containing either three or 10 EBNA2-positive cells after 5 wk (n = 5). The bar chart shows the arithmetic mean of five independent experiments and their SD. (B) Growth of M81-infected B cells during the first weeks after infection (n = 5). Mean values of five independent B cell infection experiments are shown. (C) An LCL generated with M81/ΔE1 + 2 was stably transfected with a plasmid that encodes a truncated form of NGFR and the M81 EBERs or with a plasmid that encodes NGFR only (control vector) (n = 5). After 21 d, the NGFR-positive cells were purified with a specific antibody, and we monitored cell growth for 10 d. Mean values of five independent B cell infection experiments are shown. (D) Primary epithelial cells were infected with a lentivirus that expresses the M81 or B95-8 EBERs. We monitored cell growth in these cells and in cells infected by a control lentivirus for 7 d. We analyzed three independent primary samples and show here one sample (SEC67). (E) BrdU incorporation assays were performed with independent B cell samples transformed with wild-type M81 virus or M81/ΔE1 + 2 mutant at day 45 postinfection (n = 5). The ratio of cells in the G0/G1 and in the G2/M phase for each sample is given in the scatter plot. Central horizontal lines represent means, and error bars indicate SD. All P values were obtained from two-tailed paired t tests performed with the two types of LCLs. (F) B cells infected by M81 or M81/ΔE1 + 2 were cytospinned and stained for α-tubulin to visualize the mitotic spindle and with DAPI (n = 5). The figures show cells in metaphase and anaphase. (Scale bar, 10 μm.) For each sample, at least 100 mitotic cells were examined. The graphs give the percentage of cells undergoing metaphase or anaphase. Central horizontal lines represent means, and error bars indicate SD. All P values were obtained from two-tailed paired t tests performed with the two types of LCLs. (G) We compared B cell growth after infection with M81, M81/ΔE1, M81/ΔE2, and M81/ΔE1 + 2 by counting the number of outgrowing wells in 96-well plates seeded with infected primary B cells containing either 3 or 10 EBNA2-positive cells after 5 wk (n = 5). The bar chart shows the arithmetic mean of five independent experiments and their SD. (H) Growth of M81- and M81 deletion mutant-infected B cells (see G) during the first weeks after infection (n = 5). Mean values of five independent B cell infection experiments are given.

