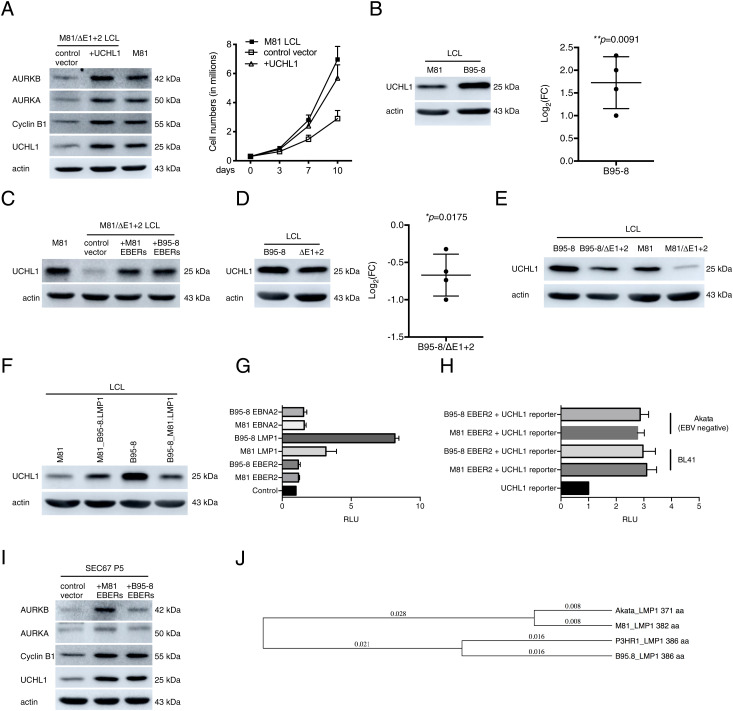
Fig. 4.
UCHL1 enhances cyclin B1 and Aurora kinase expression in infected cells. (A) An LCL generated with M81/ΔE1 + 2 was stably transfected with a plasmid that encodes a truncated form of NGFR and the UCHL1 gene or with a plasmid that encodes NGFR only (control vector). The NGFR-positive cells were purified with a specific antibody and immunoblotted with antibodies specific to UCHL1, cyclin B1, AURKA, and AURKB. The data are representative of three independent experiments (n = 3). The same cells were kept in culture and growth was monitored for 10 d. Mean values of three independent B cell infection experiments are shown (n = 3). (B) We show representative immunoblot analyses on LCLs generated with M81 or B95-8 using antibodies specific for UCHL1 and actin (n = 4). We determined the relative intensity of the signals quantified by the ImageJ software over the loading control (actin). For each sample, the log2-transformed FC is given based on the relative signals displayed by M81/ΔE1 + 2 and M81 wild-type. Central horizontal lines represent means and error bars indicate SD. The statistical significance of the assay was evaluated with a one-sample t test. (C) An LCL transformed by M81/ΔE1 + 2 was stably transfected with a plasmid that encodes a truncated form of NGFR and the EBERs, from either M81 or from B95-8, or with a plasmid that encodes NGFR only (control). The NGFR-positive cells were purified with a specific antibody and subjected to immunoblotting using a UCHL1-specific antibody. M81 wild-type LCLs were used as a positive control. The graph shows one representative experiment (n = 5). (D) We show representative immunoblot analyses on LCLs transformed with B95-8 and B95-8/ΔE1 + 2 with antibodies specific for UCHL1 and actin (n = 4). For each sample, the log2-transformed FC is given based on the relative signals displayed by M81/ΔE1 + 2 and M81 wild-type. Central horizontal lines represent means, and error bars indicate SD. The statistical significance of the assay was evaluated with a one-sample t test. (E) We show representative immunoblot analyses on LCLs infected with B95-8, B95-8/ΔE1 + 2, M81, and M81/ΔE1 + 2 with antibodies specific for UCHL1 and actin (n = 3). (F) Western blot performed on LCLs transformed with M81, M81_B95-8.LMP1, B95-8, and B95-8_M81.LMP1 using antibodies specific for UCHL1 and actin. The data are representative of two independent experiments. (G) NIH 3T3 cells were transfected with plasmids encoding LMP1 or EBNA2 or EBER2 from either M81 or B95-8 along with a UCHL1p-Luc reporter plasmid and 200 ng of the pRL Renilla expression vector. The total amount of DNA in all transfections was kept constant by adding control vectors. Luciferase assays were performed 48 h posttransfection. Renilla and Firefly luciferase signals were measured using the Dual-Luciferase Assay System Kit. Renilla luciferase signals were used for normalization of the Firefly luciferase signal. The relative light units (RLU) between the luminescence levels generated by expression of the expression constructs and the control constructs are given in a graph of bars that represent the mean of five independent experiments with error bars representing the SD (n = 5). (H) BL41 (EBV-negative) and Akata (EBV-negative) were transfected with each of the given constructs along with UCHL1p-Luc reporter plasmid and the pRL Renilla expression vector. Luciferase assays were performed as described in G (n = 3). (I) Primary epithelial cells were infected with a lentivirus that expresses the M81 or B95-8 EBERs. We determined the UCHL1, cyclin B1, AURKA, and AURKB expression in these cells relative to controls using Western blot. The data are representative of three independent experiments (n = 3). (J) Distance trees based on available EBV LMP1 protein sequences.

