Fig. 5.
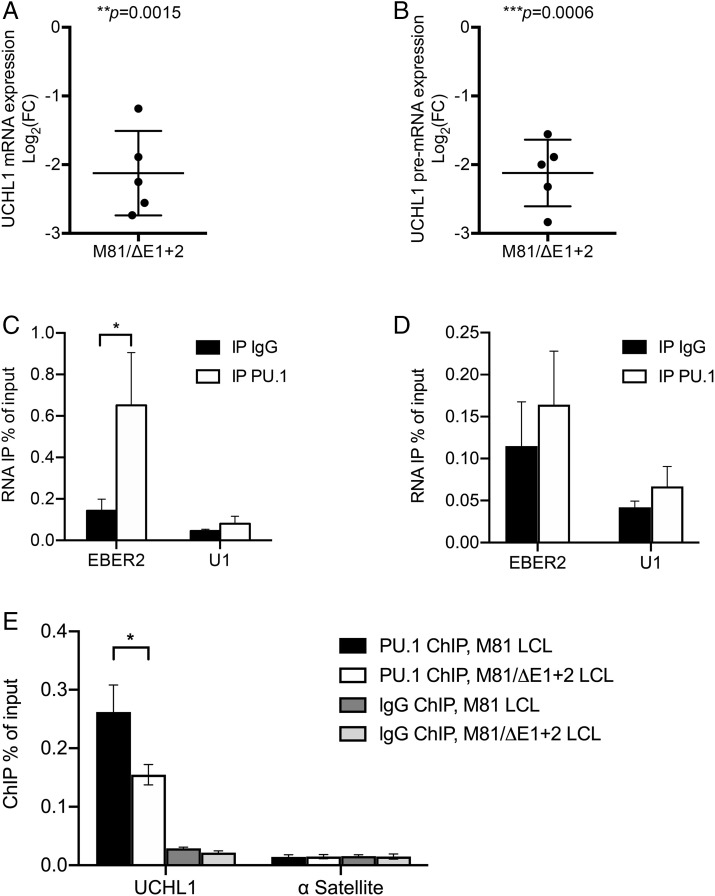
EBER2 mediates an indirect and potent interaction between PU.1 and the UCHL1 transcript. (A) We determined UCHL1 mRNA expression in B cells infected with M81 or M81/ΔE1 + 2 by RT-qPCR (n = 5). For each sample, the log2-transformed fold change (FC) is given based on the relative signals displayed by M81/ΔE1 + 2 and M81 wild-type. Central horizontal lines represent means, and error bars indicate SD. The statistical significance of the assay was evaluated with a one-sample t test. (B) Same as in A for UCHL1 pre-mRNA expression. (C) We determined EBER2 level by qRT-PCR following IP with IgG (negative antibody control) or with anti-PU.1 antibody in samples subjected to prior formaldehyde cross-linking. U1 was utilized as negative control located in the nucleus. Values are given as the average of three independent experiments ± SD (n = 3). Statistical analysis used a two-tailed paired Student’s t test. *P = 0.0472. (D) same as in C but without formaldehyde cross-linking. (E) PU.1 localization at the UCHL1 promoter region in B cells infected with M81 or M81/ΔE1 + 2 was measured by ChIP-qPCR. IgG was used as a negative antibody control in immunoprecipitations. The human α Satellite repeat region not bound by PU.1 served as a negative control. All data represent the mean of three independent experiments ± SD (n = 3). Statistical analysis used a two-tailed paired Student’s t test. *P = 0.02.

