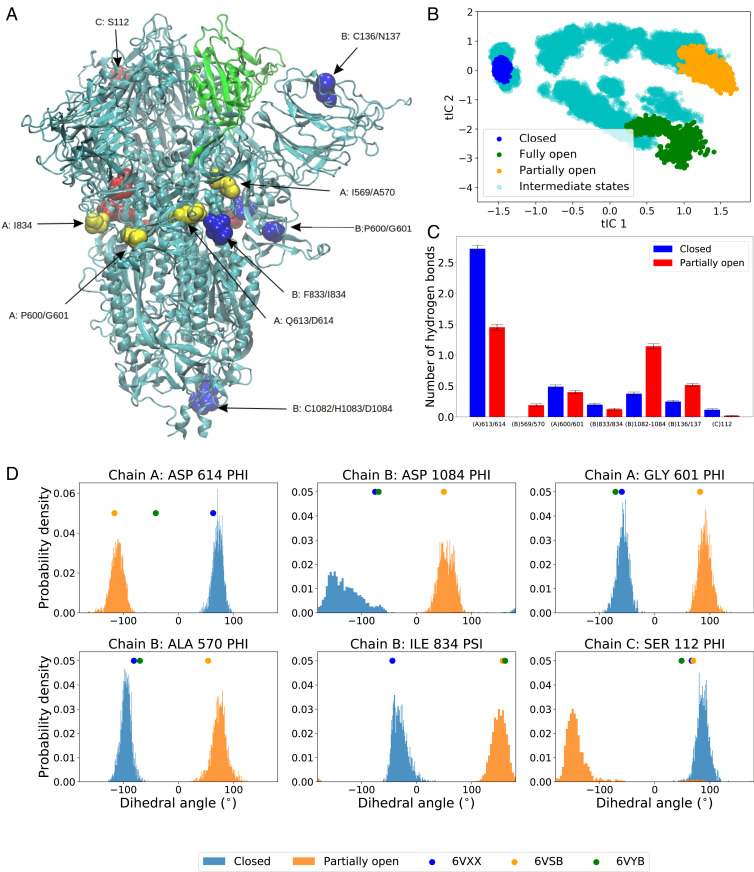
Fig. 2.
(A) Structure of spike protein with the residues in RBD shown in green color. Non-RBD residues strongly correlated with the RBD opening motion are represented by spheres (color code: chain A, yellow; chain B, blue; chain C, red). The RBD of chain A is performing down-to-up conformational change. (B) The projection of all unbiased trajectories along the two slowest degrees of freedom (tICs) obtained from tICA analysis. (C) Average number of hydrogen bonds for the highest correlated residues/residue pairs (Table 1) in the closed and the partially open states. (D) Normalized distribution of representative backbone dihedral angles strongly correlated with tIC 1 and tIC 2 (Table 1). The distributions are calculated from closed and partially open state trajectories. The corresponding values of the dihedral angles in the PDB structures are marked in the plot for reference.

