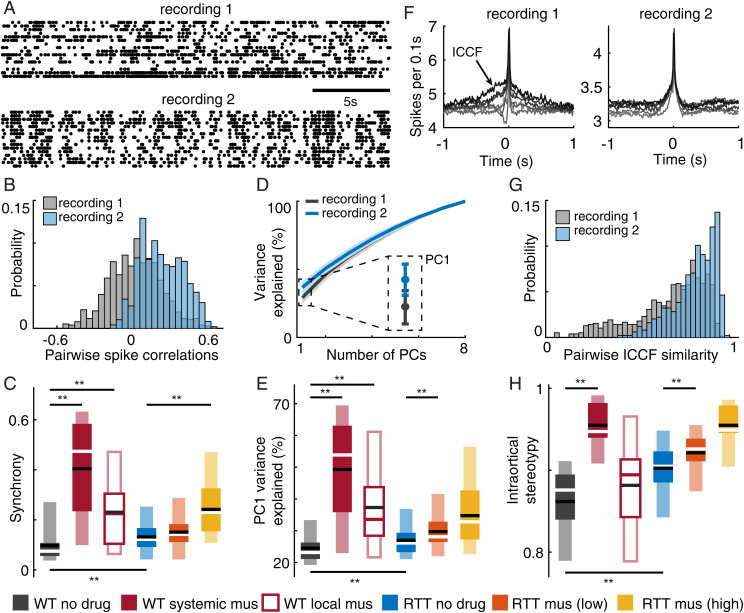
Fig. 2.
Decreased complexity of neural activity due to MeCP2 disruption and excessive inhibition. (A) Example spike rasters from a WT no-drug recording (recording 1) with weaker correlations among neurons and an example RTT no-drug recording (recording 2) with stronger correlations. (B) Distributions of all pairwise spike count correlations for the two recordings in A. We defined the average across all pairs as synchrony. (C) Summary of all recordings shows increased synchrony in RTT rats compared to WT rats. Similarly, increasing inhibition results in increased synchrony. (D) For the example recording with greater synchrony (blue), PCA analysis shows that PC1 explains more variance. (E) Summary of the variance explained by PC1 follows the same trends as synchrony in C. (F) Several example spike-triggered average spike histograms (ICCFs) are shown for the example recordings. Note that the ICCFs are more similar in shape for recording 2 (RTT) than recording 1 (WT). (G) Distributions summarize the similarity for all possible pairs of ICCFs. The average of all similarities defines the “intracortical stereotypy” for each recording. (H) Summary of intracortical stereotypy for all recordings and experimental groups. Normal rats (WT) were the least stereotyped; RTT and increased inhibition have elevated stereotypy. Asterisks indicate t-test significance: **P < 0.01. Dark and light boxes delineate 0.25 to 0.75 and 0.05 to 0.95 quantiles, respectively. Lines mark mean (black) and median (white, red).

