Fig. 1.
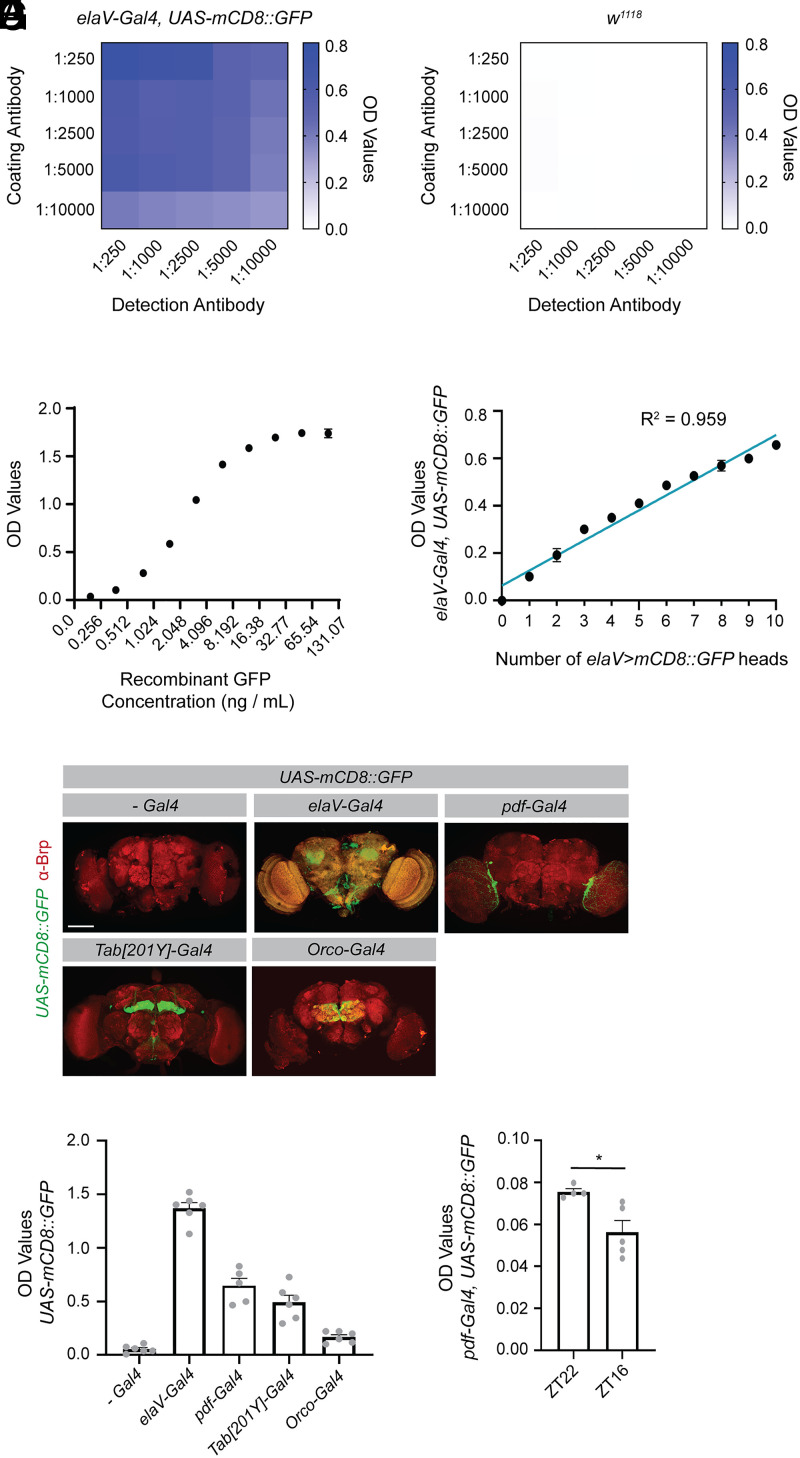
An ELISA can be used to quantify GFP levels in Drosophila in diverse cell populations. An ELISA was optimized to detect GFP in Drosophila lysates. (A) For each sample, lysates were prepared from 5 heads collected from flies expressing a membrane-localized GFP under the control of the pan-neuronal elaV driver. Optical density (OD) values were recorded with different concentrations of coating antibody (chicken αGFP) and detection antibody (mouse αGFP). Depicted OD values represent the mean of two biological replicates. (B) A parallel analysis was performed as in A but in lysates containing 5 heads from w1118 flies. (C) Indicated concentrations of recombinant GFP were evaluated by ELISA and the resulting OD values are shown. Six replicates were performed for each concentration. (D) Ten fly heads were prepared for each sample, with the number on the x axis representing the number of heads from elaV > mCD8::GFP-expressing flies. The remaining heads in each sample were from w1118 flies. OD values were recorded from three replicates. A correlation analysis was performed using a simple linear regression. (E) Flies expressing the indicated drivers were crossed with UAS-mCD8::GFP flies, their brains dissected at 10 to 12 d posteclosion (dpe) and stained for Brp. The GFP depicted is from the endogenous GFP signal. Images were acquired at 20x magnification and represent maximum projections of z slices taken every 3 μm through the brain. (F) Five fly heads from each of the indicated genotypes were prepared for each sample and the OD values assessed by ELISA (no Gal4 (-Gal4) n = 6, elaV-Gal4 n = 6, pdf-Gal4 n = 5, Tab[201Y]-Gal4 n = 6, Orco-Gal4 n = 6). (G) Five fly heads were collected for each sample from flies expressing a membrane-localized GFP under the control of the pdf driver. Flies were collected at ZT22, shortly before the onset of light, and at ZT16 shortly after the onset of the dark phase. OD values for these samples were assessed by ELISA (unpaired, two-sided t test; ZT22 n = 4, ZT16 n = 5). Graphs represent the mean ± SEM *P < 0.05. (Scale bar, 100 μm.)

