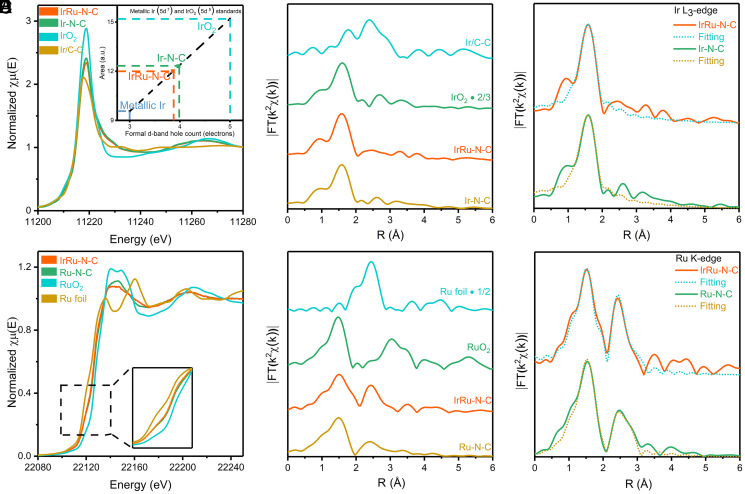
Fig. 2.
Structural analyses. (A) XANES of Ir L3-edge spectra; the inset is used to confirm the Ir valence by L3-edge area integration. (B) Fourier transform of k2-weighted Ir L3-edge EXAFS data. (C) Experimental and best-fitting IrRu-N-C and Ir-N-C results of the Ir L3-edge EXAFS. (D) XANES of Ru K-edge spectra; the inset is used to evaluate the Ru valence. (E) Fourier transform of k2-weighted Ru K-edge EXAFS data. (F) Experimental and best-fitting IrRu-N-C and Ir-N-C of the Ru K-edge EXAFS results.

